Will recent gains of EOS translate into a change in trend going forward

EOS has been in a downtrend since mid-September, interspersed with periods of ranging price action. In the past couple of weeks, the price has seen a strong bounce from the $1.99 lows, to reach a level of resistance at $2.69. Although it was an impressive run of 36% in a period of a little more than a fortnight, the downtrend from September remained unbroken.
EOS- 12H
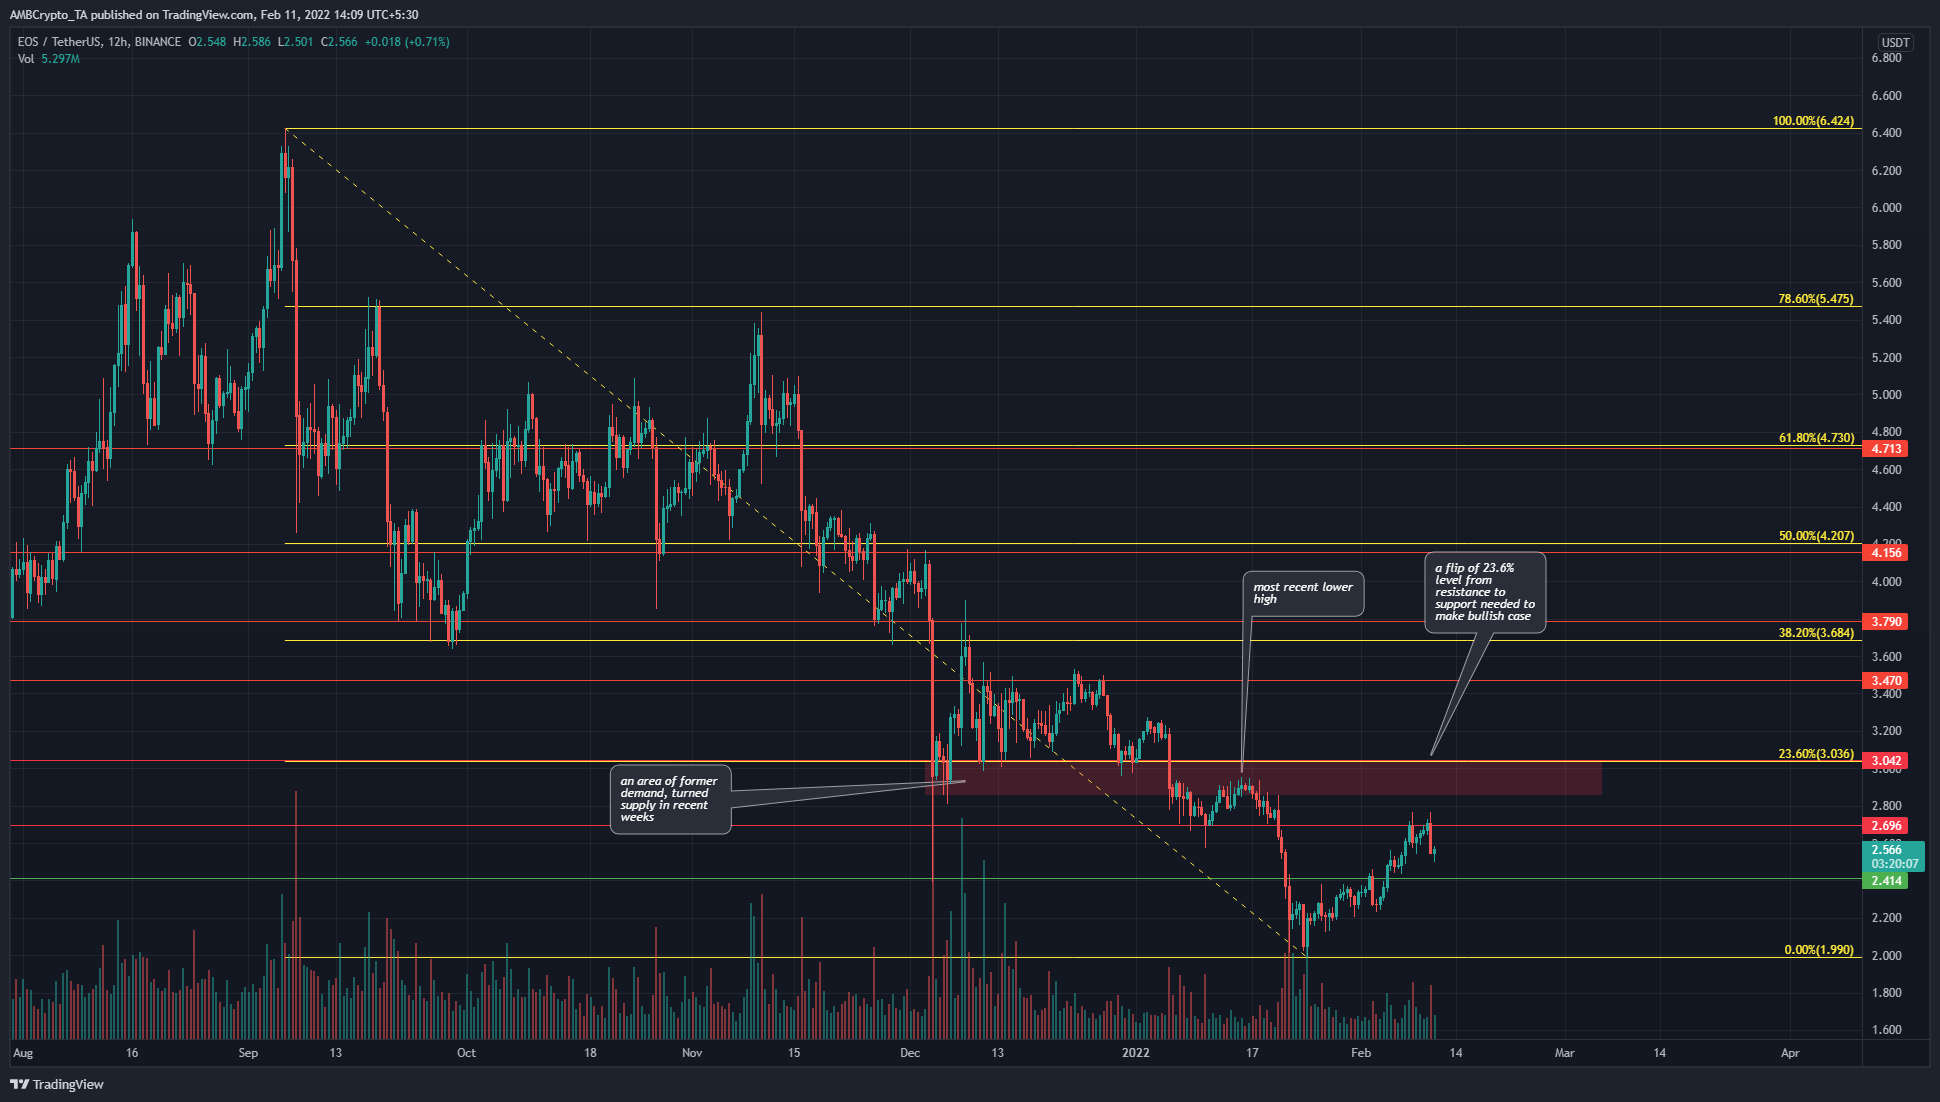
The $3 area, highlighted in red, was an area where the price repeatedly sunk to in December and bounced away from. However, it was unable to climb past the $3.47 level for the majority of December. In early January, the price sank beneath this area of demand and retested it from below, confirming it as an area of supply.
In the past couple of weeks, the price has been trending upward on lower timeframes, but the 12-hour chart showed this bounce to be an opportunity to enter short positions near $3, rather than a true reversal in trend from bearish to bullish.
The Fibonacci retracement levels (yellow) were plotted based on EOS’ move from $6.42 to $1.99 and showed the $3 level as the 23.6% retracement level- adding significance to this level.
A move above $3 would therefore be necessary to consider a shift in market structure from bearish to bullish.
Rationale
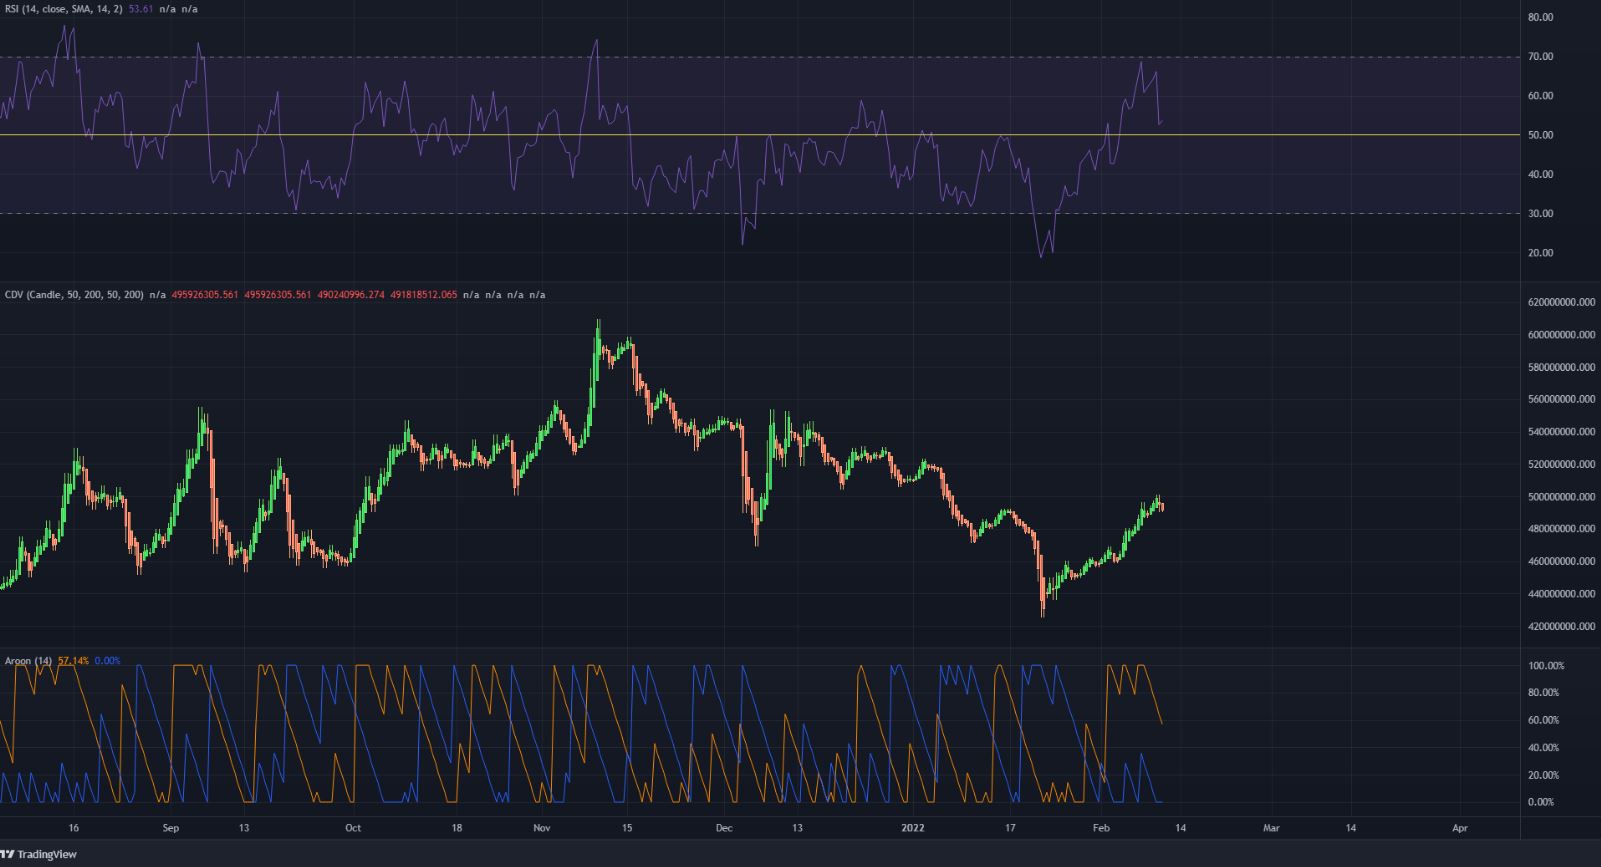
The RSI has been below neutral 50 for almost the entirety of November and December and only climbed above neutral 50 in late January. At the time of writing it was descending back toward the 50 value.
In agreement with this, the Aroon Indicator showed that the better part of the last three months has been spent in a steady downtrend (where the Aroon Down, blue, has been high). There have been periods of ranging price action where neither trend could get established on the indicator.
The Cumulative Delta Volume indicator showed steady buying volume in the past three weeks.
Conclusion
The market structure remained bearish, while the momentum looked to have lost strength at the $2.69 resistance level. Steady demand for the coin has been seen in the past three weeks but $3 remained a significant level for the bulls to overcome.