Will Solana [SOL] be able to repair investors’ confidence in May

Disclaimer: The findings of the following analysis are the sole opinions of the writer and should not be considered investment advice.
Solana investors had reason to worry based on the token’s performance on the charts. The network also suffered yet another major outage recently as NFT mining bots sent millions of transactions to the network, overloading it and causing a seven-hour downtime. Will Solana be able to repair investor confidence, and will this be reflected on the price charts?
SOL- 1 Day Chart
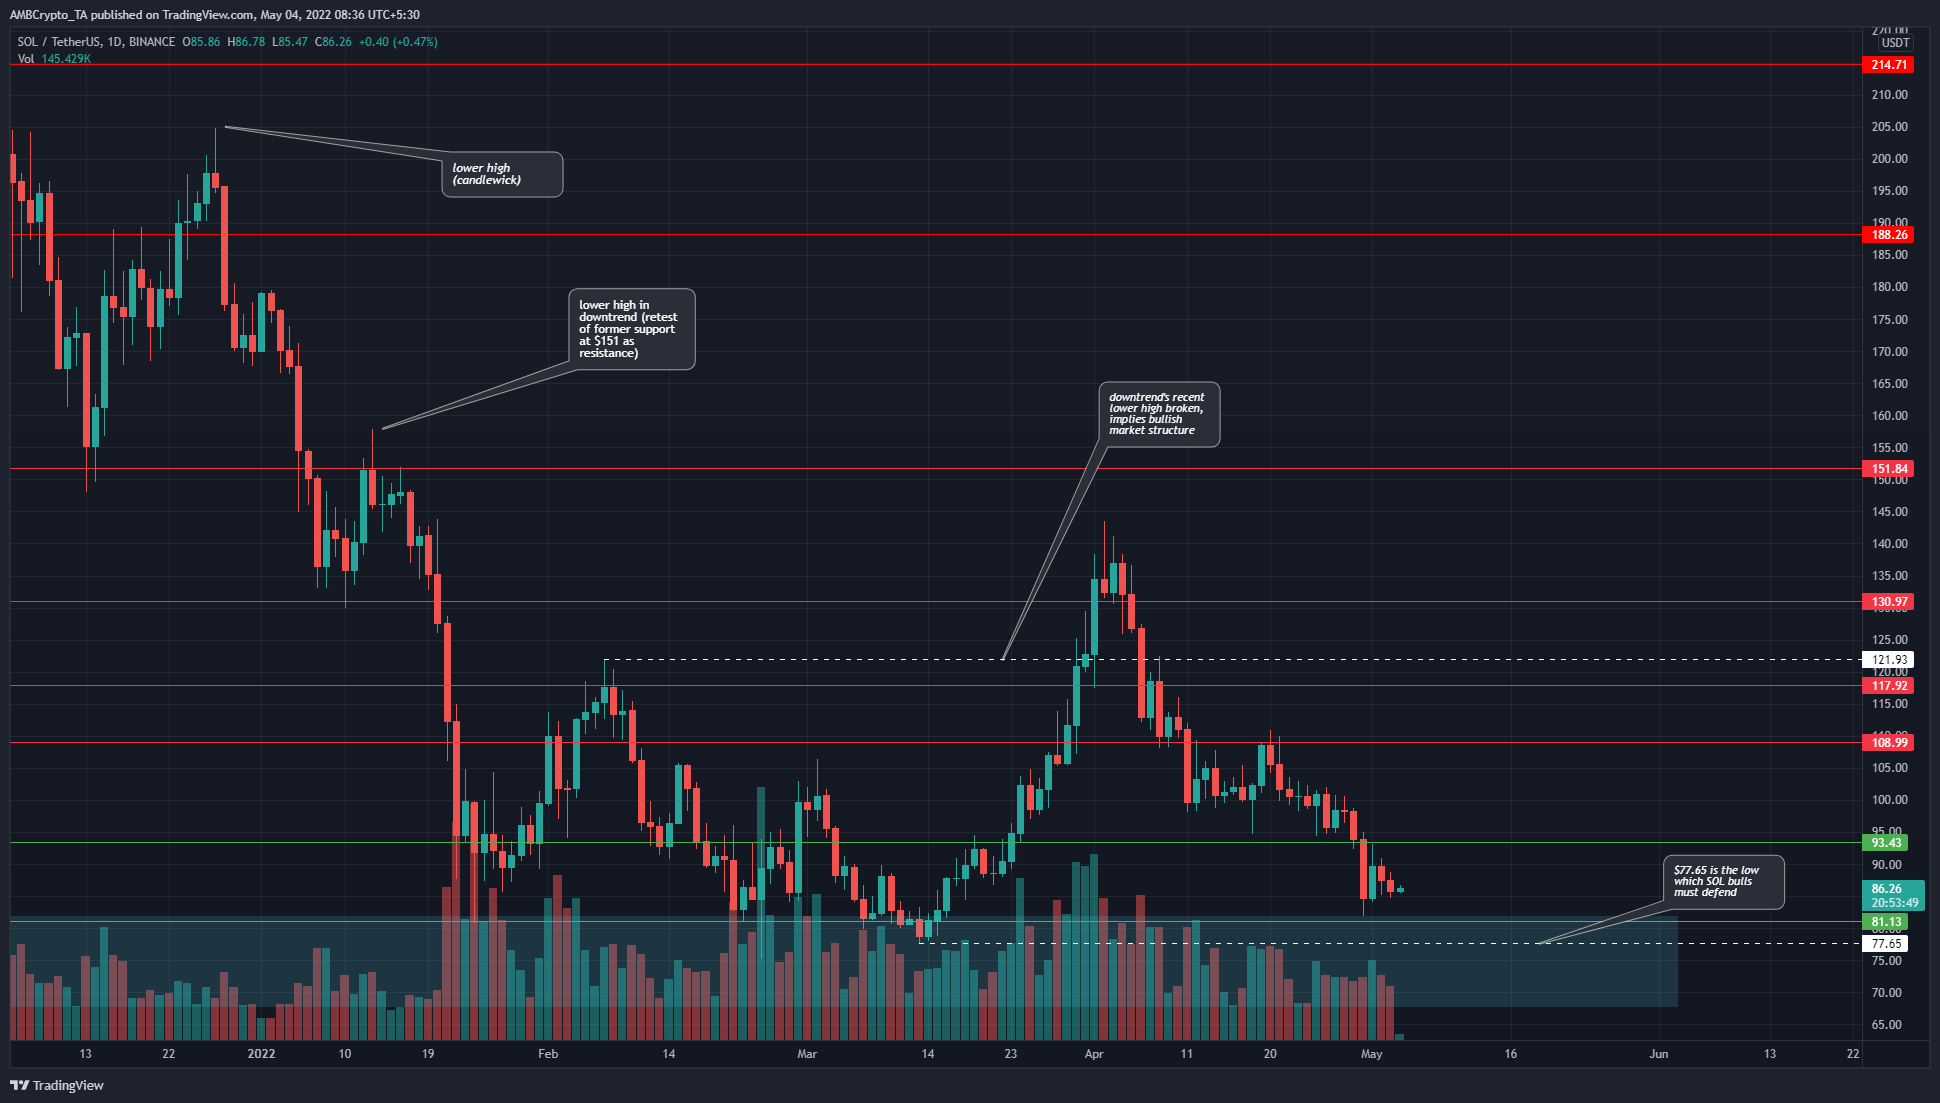
Solana had been on a downtrend from November as it set a series of lower highs and lower lows. In March, SOL descended into the $70 zone of demand and saw a strong rally. This rally broke above the previous lower high of the downtrend. This development flipped the market structure from bearish to bullish.
Now, the previous lows at $77.65 is a level that SOL bulls would be looking to defend. If SOL descended beneath this level, the bullish structure would once more become bearish.
On lower timeframes, the move from $140 to $82 was a downtrend, as $117 and $108 were flipped from support to resistance. However, this was not the case on the daily chart. So which direction would SOL lean toward in the weeks to come?
Rationale
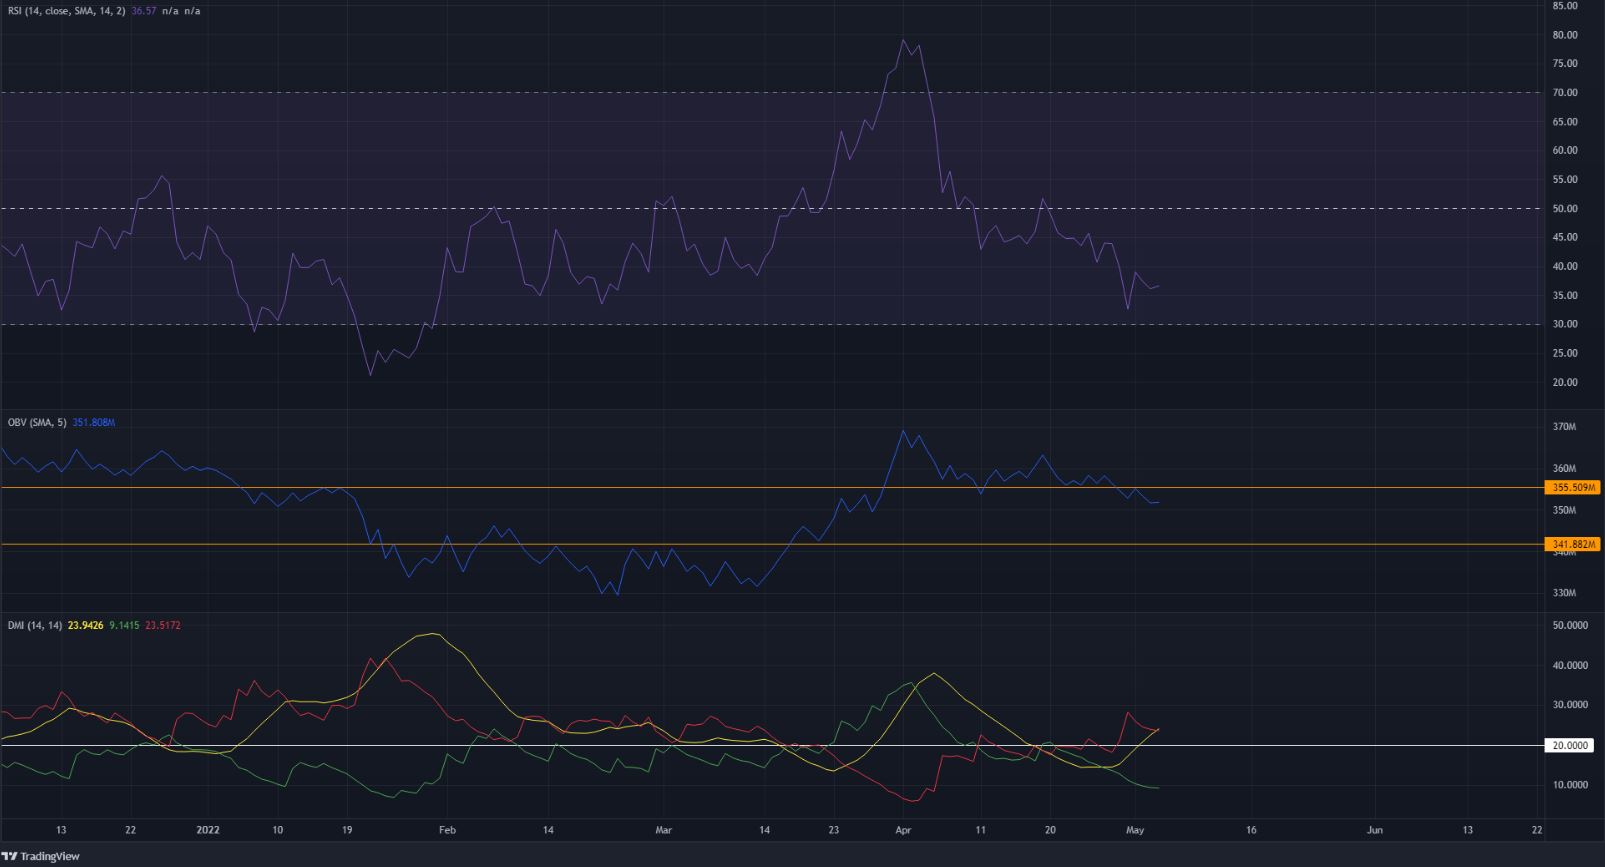
The RSI was at 36, which is strong bearish momentum. Moreover, the RSI has been below neutral 50 since 10 April, which was indicative of a shift in momentum toward bearish. The RSI would need to climb past neutral 50, alongside the price recovering above $93, which would be an early sign that bulls were in the driving seat once more.
However, the OBV is also important to keep an eye on. The OBV slipped beneath a level that had some significance in the past few months, and this was a sign of strong selling volume. Hence, the OBV would also need to spike upward to show strength on the bulls’ side.
The Directional Movement Index showed a surging ADX (yellow) and -DI (red) above the 20 value, which implied a strong bearish trend in progress.
Conclusion
The $77.65 and $93.43 levels are the ones to watch out for in the days to come. A dip below $77 would flip the bias to bearish, while a session close above $93.43 would indicate that Solana was likely to see further gains.