
Disclaimer: The findings of the following analysis are the sole opinions of the writer and should not be considered investment advice
Polkadot climbed past $17.5 on the charts and flipped it to support before its move toward $19- but buying pressure seemed to be lacking in the near-term outlook. Bitcoin was trading just above the $39k mark, and the short-term direction of the king of crypto on the charts was not too clear either. Weekends are also times of lower liquidity. Will Polkadot’s rally push it past $19 or was the selling pressure likely to be dominant?
DOT- 1H
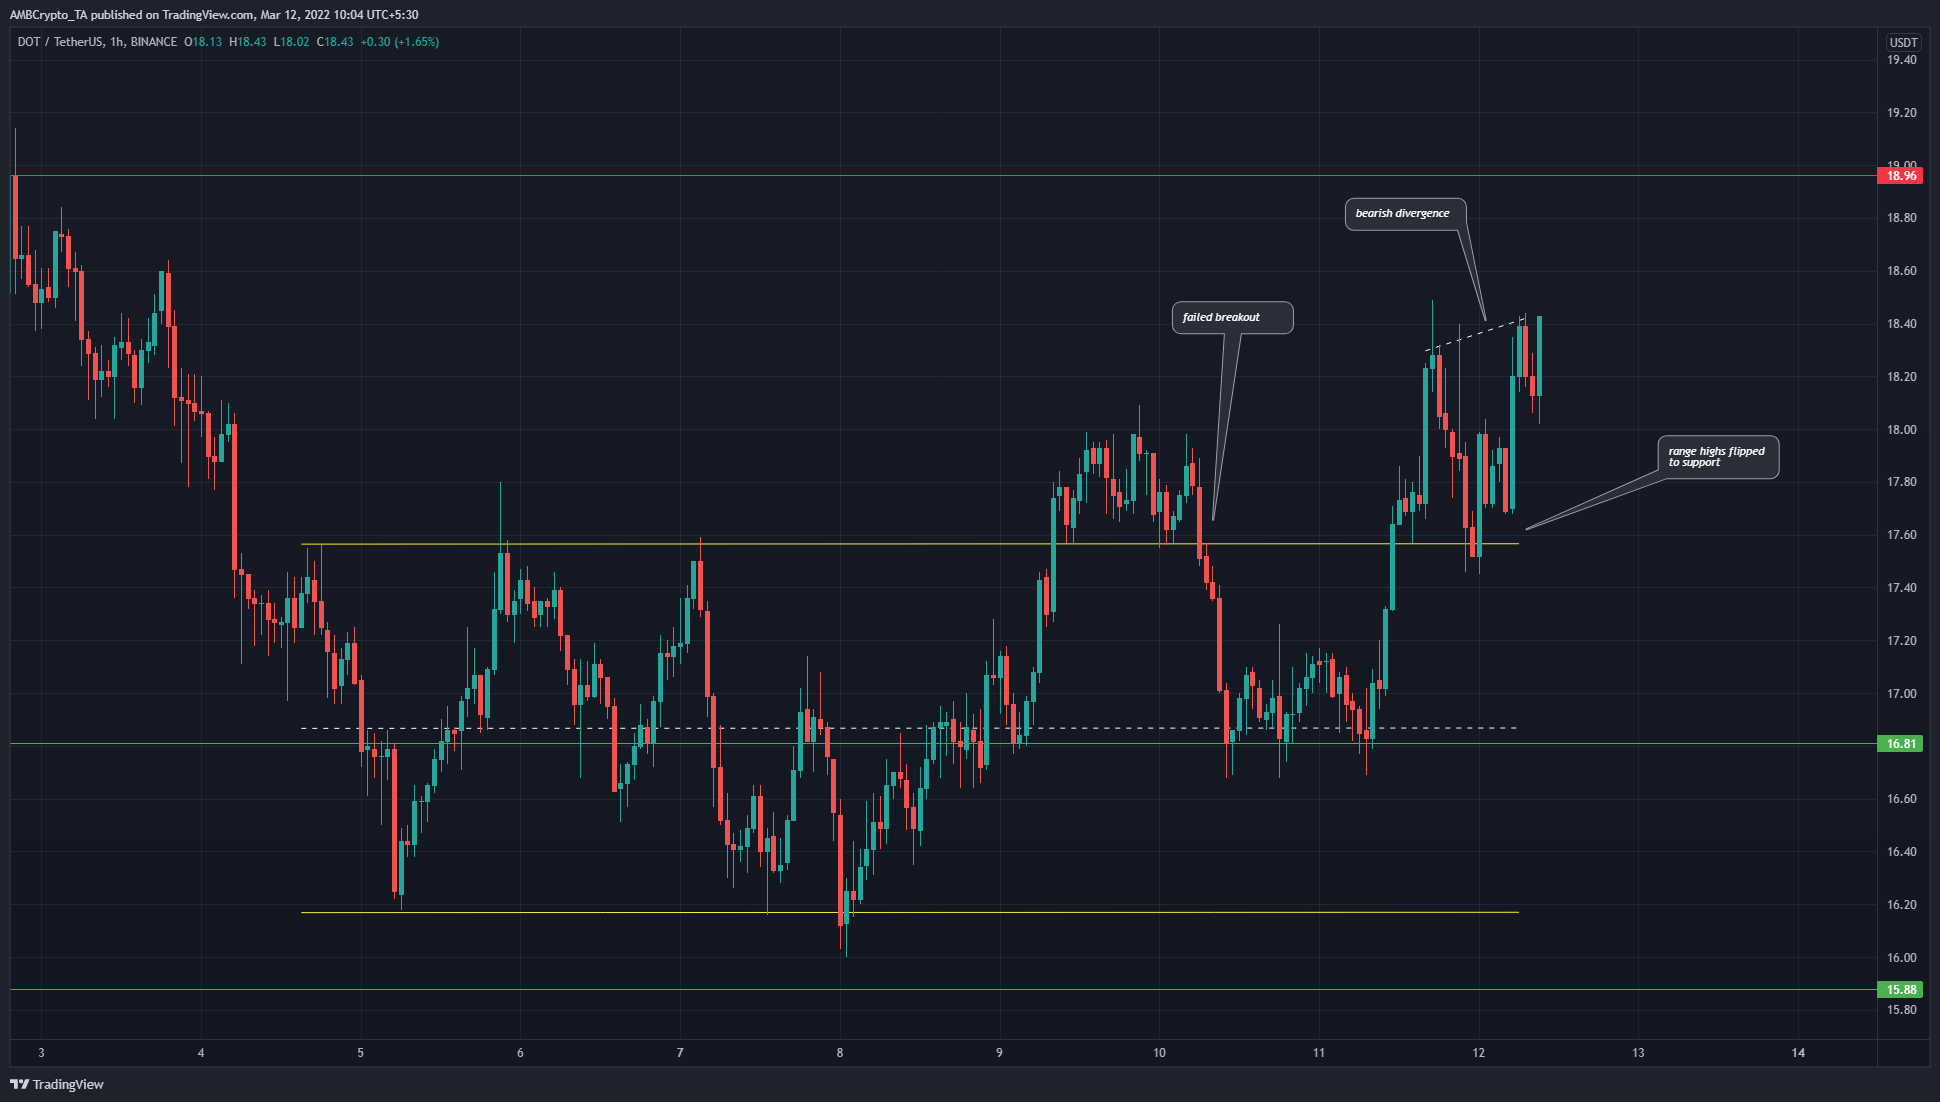
Source: DOT/USDT on TradingView
In the past week, Polkadot had traded within a range from $16.17 to $17.57. This mid-point of this range was at $16.87 and had some confluence with a longer-term support level at $16.81. In the past few days, DOT has found some support at this confluence of support levels.
On the first attempt at a breakout past the range highs, DOT was unable to hold on to the range highs once $17.6 was flipped to support. Bitcoin saw a pullback to $38.8k from $42k and DOT was forced lower as well.
On its second attempt, the price was able to establish a higher high (near-term) and also find demand at $17.6, which meant that the short-term market structure was bullish.
To the north, the $19 area posed significant resistance to the bulls’ endeavors. Therefore, a near-term buying opportunity could arise if this level were flipped to support. To the south, the $17.6 would need to remain unbroken for DOT to climb higher. A session close below $17.6 could see DOT fall back toward $16.2.
Rationale
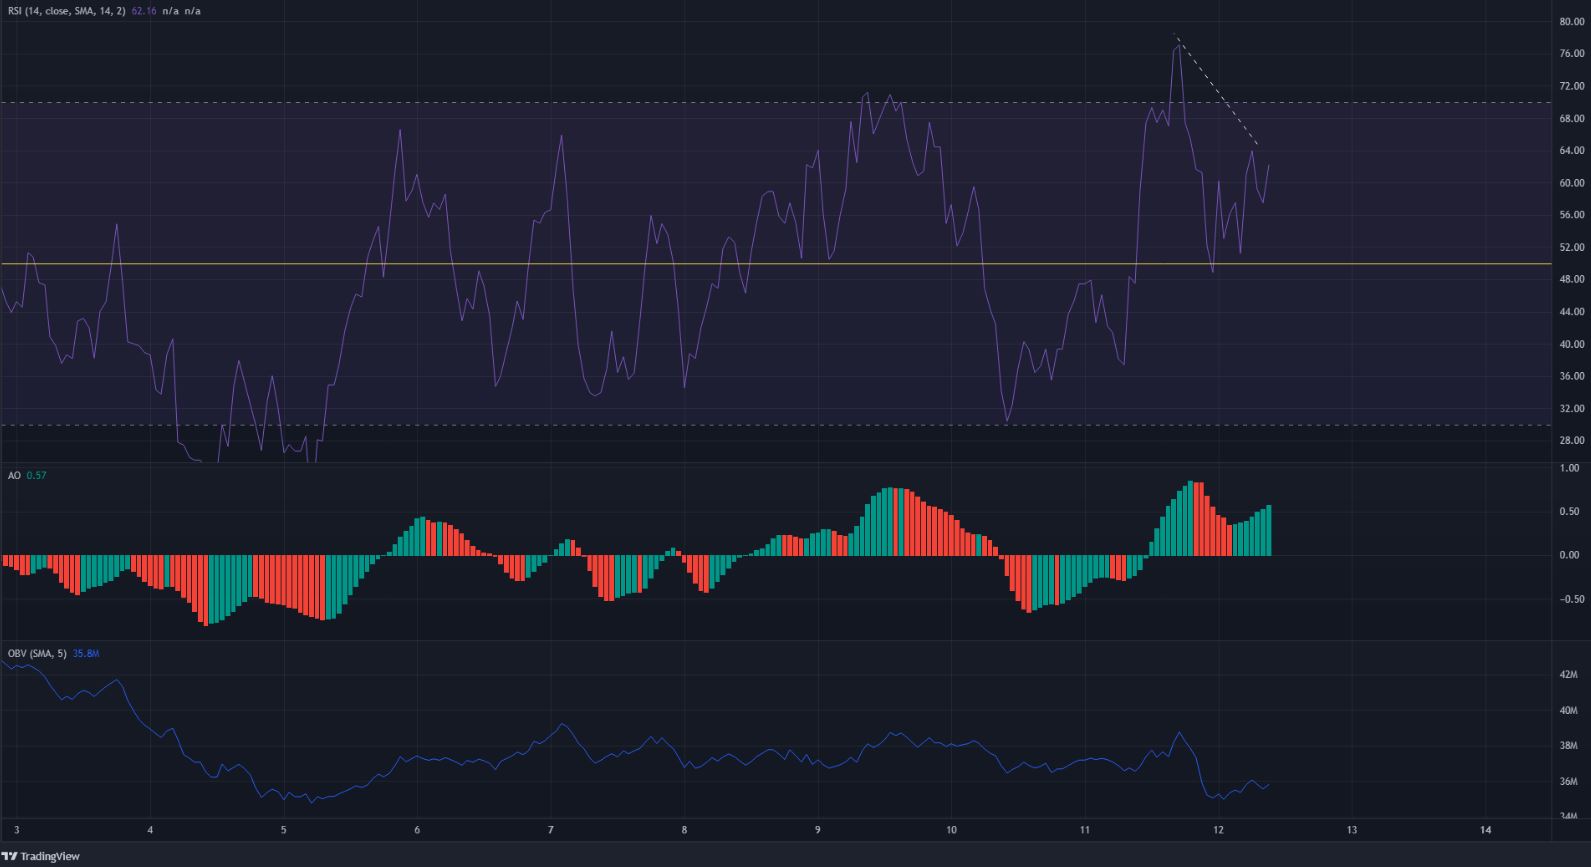
Source: DOT/USDT on TradingView
The RSI stood at 62.16 and showed strong bullish momentum in recent hours. However, it also displayed a bearish divergence between price and momentum. The Awesome Oscillator also appeared to be forming a lower peak even as the price pushed higher.
Alongside, the OBV showed that buying volume has not been particularly high after the retest of $17.6.
Conclusion
The indicators showed that the next few hours might see a pullback to the $17.6 region for Polkadot. $19 posed strong resistance and can be used as a take-profit level. A move back below $17.6 in the next couple of days would likely see $16.8 and $16.2 revisited. A move above $19 and retest as support would also present a buying opportunity in the near term.