With AVAX unable to flip $92 to support, where can bulls make a stand

Disclaimer: These findings are the sole opinions of the writer and should not be considered investment advice
On the daily chart, Avalanche hit a new set of lows after it broke down below the previous lows at $75.5. Bitcoin found a short-term bottom at $33k but it could still slide further, as could AVAX. Avalanche broke beneath the previous lows on a single candle.
AVAX could see fresh buyers around the $56-area, although a bearish retest of the $75-level could precede this. Bitcoin’s Dominance has bounced slightly from the 39.8% lows it was at recently and stood at 42.4%. Many altcoins could witness another wave of selling before demand can step in, and AVAX could be one of them over the next few weeks.
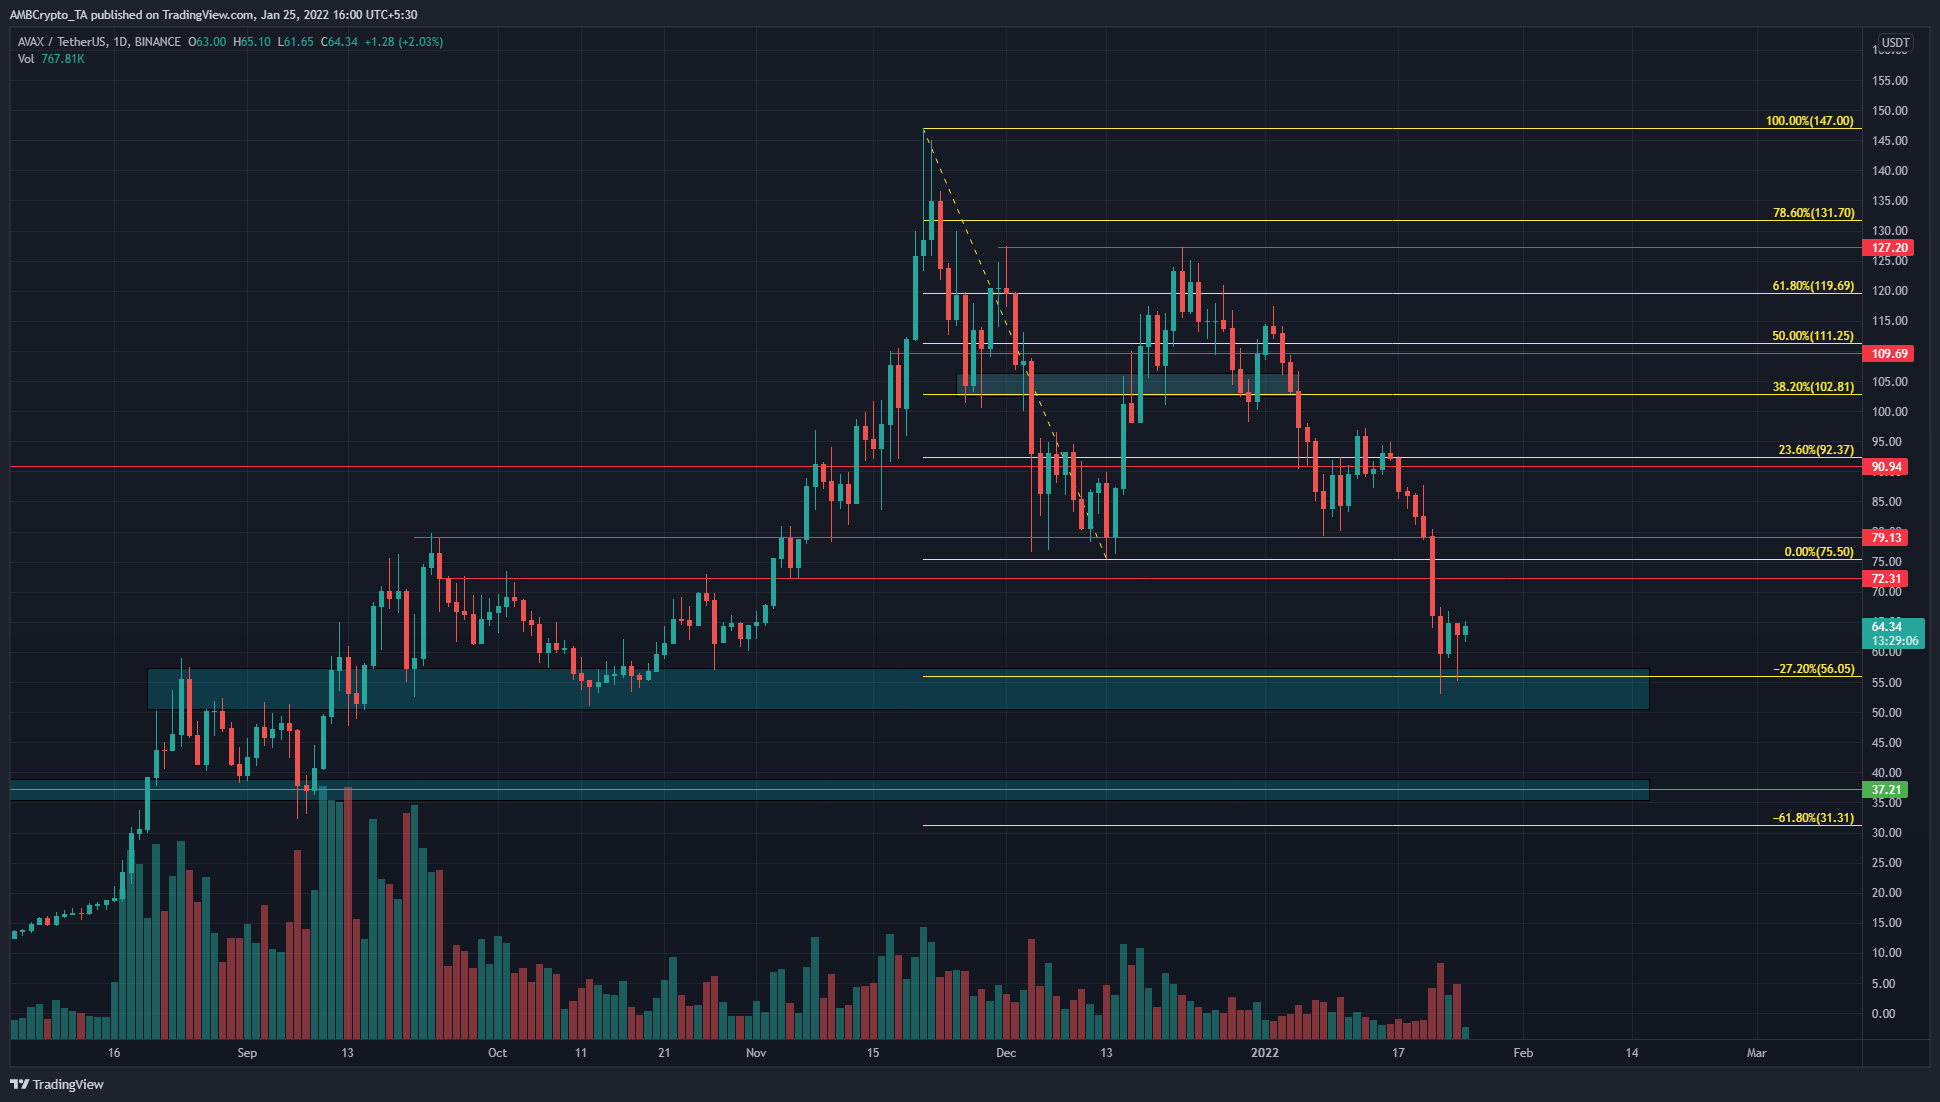
The move from $147 highs to $75.5 was used to plot a set of Fibonacci retracement and extension lines. The week prior to press time saw Bitcoin drop under $40k and AVAX also followed suit as it crashed past the previous swing low at $75.5. The 27.2% extension level at $56 saw the price briefly bounce.
This level coincided with an area of demand around the $50-$55 area (cyan box). The candlewicks to this area showed demand, but the price could visit these lows once again. Such a revisit would offer long-term investors another chance to load up. At the same time, the previous lows at $75.5 are in-between the $72.3 and $79.1 levels of resistance, marking this area as a strong supply zone.
The market structure was bearish, and therefore a retest of the $75-level could play out over the next couple of weeks, followed by a move to the $55 area.
Rationale
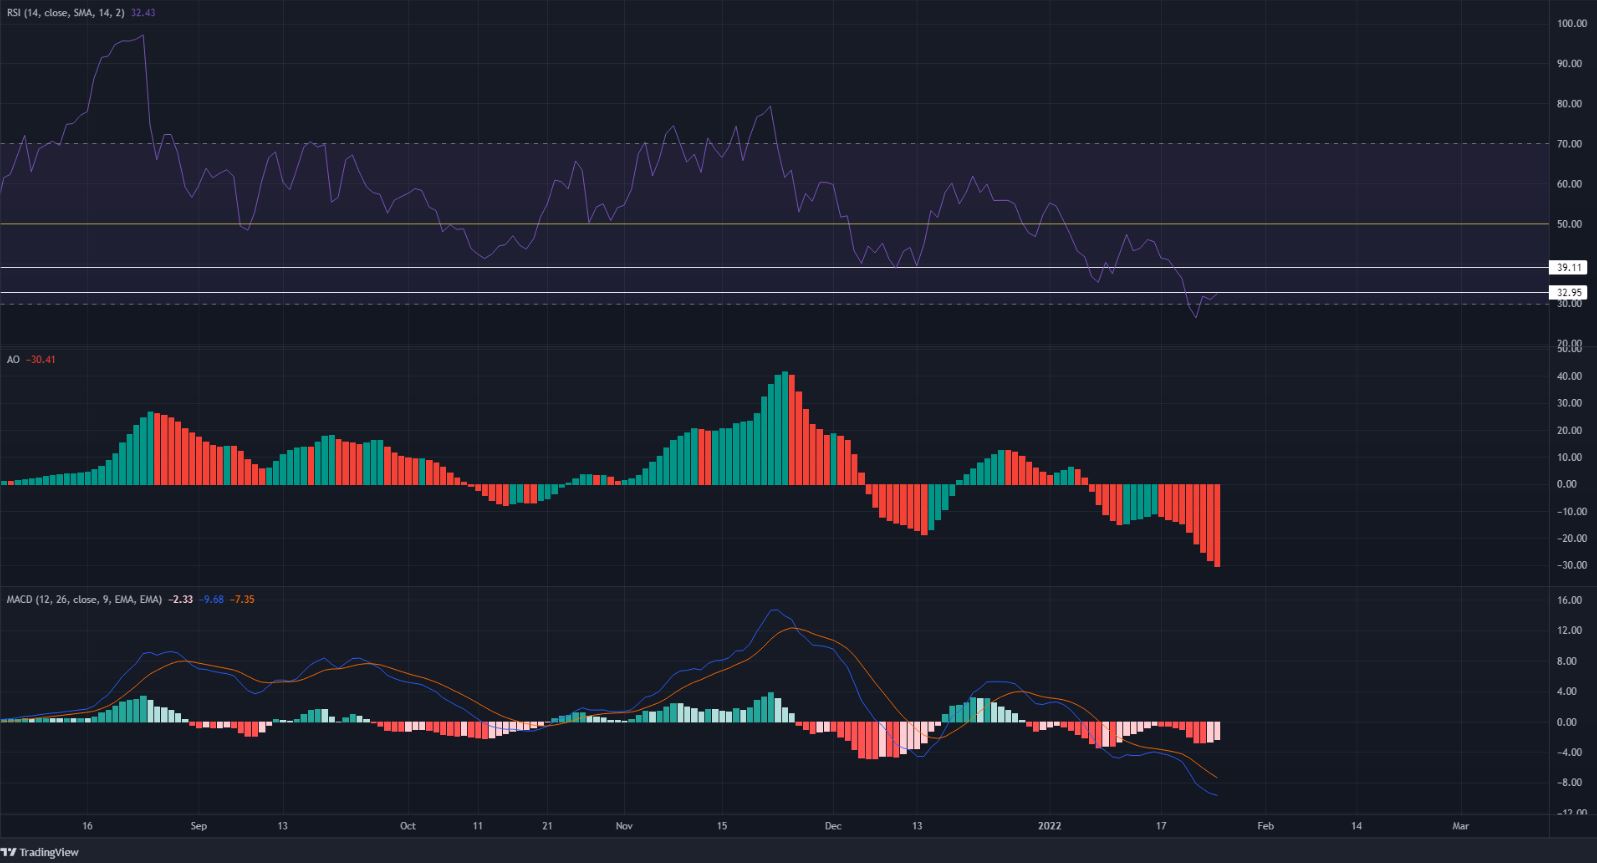
The daily RSI fell beneath 39.1 and 32.95 and at the time of writing, was just under the 32.95-level. This showed strong bearish pressure and marked out places on the chart where momentum could reverse, at least temporarily.
The Awesome Oscillator continued to print red bars and fell strongly below the zero line. The MACD also formed a bearish crossover and continued to drop below the zero line.
Conclusion
Momentum was strong with the bears. A relief bounce on the daily chart back to the $72-$79 area could occur. At the time of writing, the evidence pointed to such a scenario as a bearish retest. Such a retest might not occur and AVAX could continue to march south to the $56 area in search of demand.