With Bitcoin [BTC] holding the fort at $40k, will it be able to stage a rally soon
The last few weeks must have been hellish for paper hands who hold bitcoin (BTC). With a decline in the price of the cryptocurrency, the $40k level remained a static resistance level as the coin traded below this level for most of last week. How has the number one crypto coin fared in the past week?
And The Award For The Worst Crypto Month Goes To…
With a 17% decline in price recorded in April, Bitcoin appeared to have had the worst month yet this year. At $38, 952 at the time of this press, BTC recorded a 2.34% spike in the last 24 hours. In the last seven days, the coin recorded a measly increment of 1% in its price. Similarly, in the last week, the market capitalization for the coin declined by 4%.
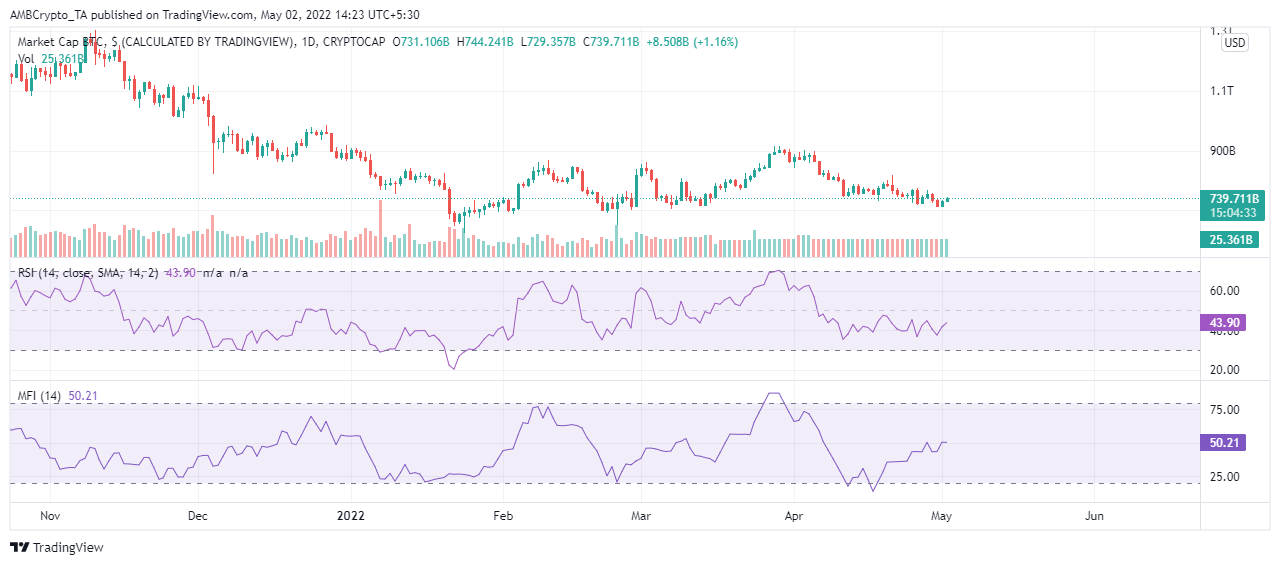
With an RSI of 43.92 at the time of this writing, BTC maintained an RSI below the 50 neutral region in the last seven days. The movements of the RSI within said period suggest a tussle between the bulls and the bears to push the coin toward the overbought and oversold region at the same time.
Within the same period, however, the Money Flow Index (MFI) took on a steady upward movement. This suggests that despite the continued decline in price, investors continue to accumulate the coin.
What about “On the Chain”
For BTC, the last seven days were also marked by a steady decline in its Trading Volume. Recording as high as 35.44b in trading volume seven days ago, at the time of this writing, the coin has shed 19%.

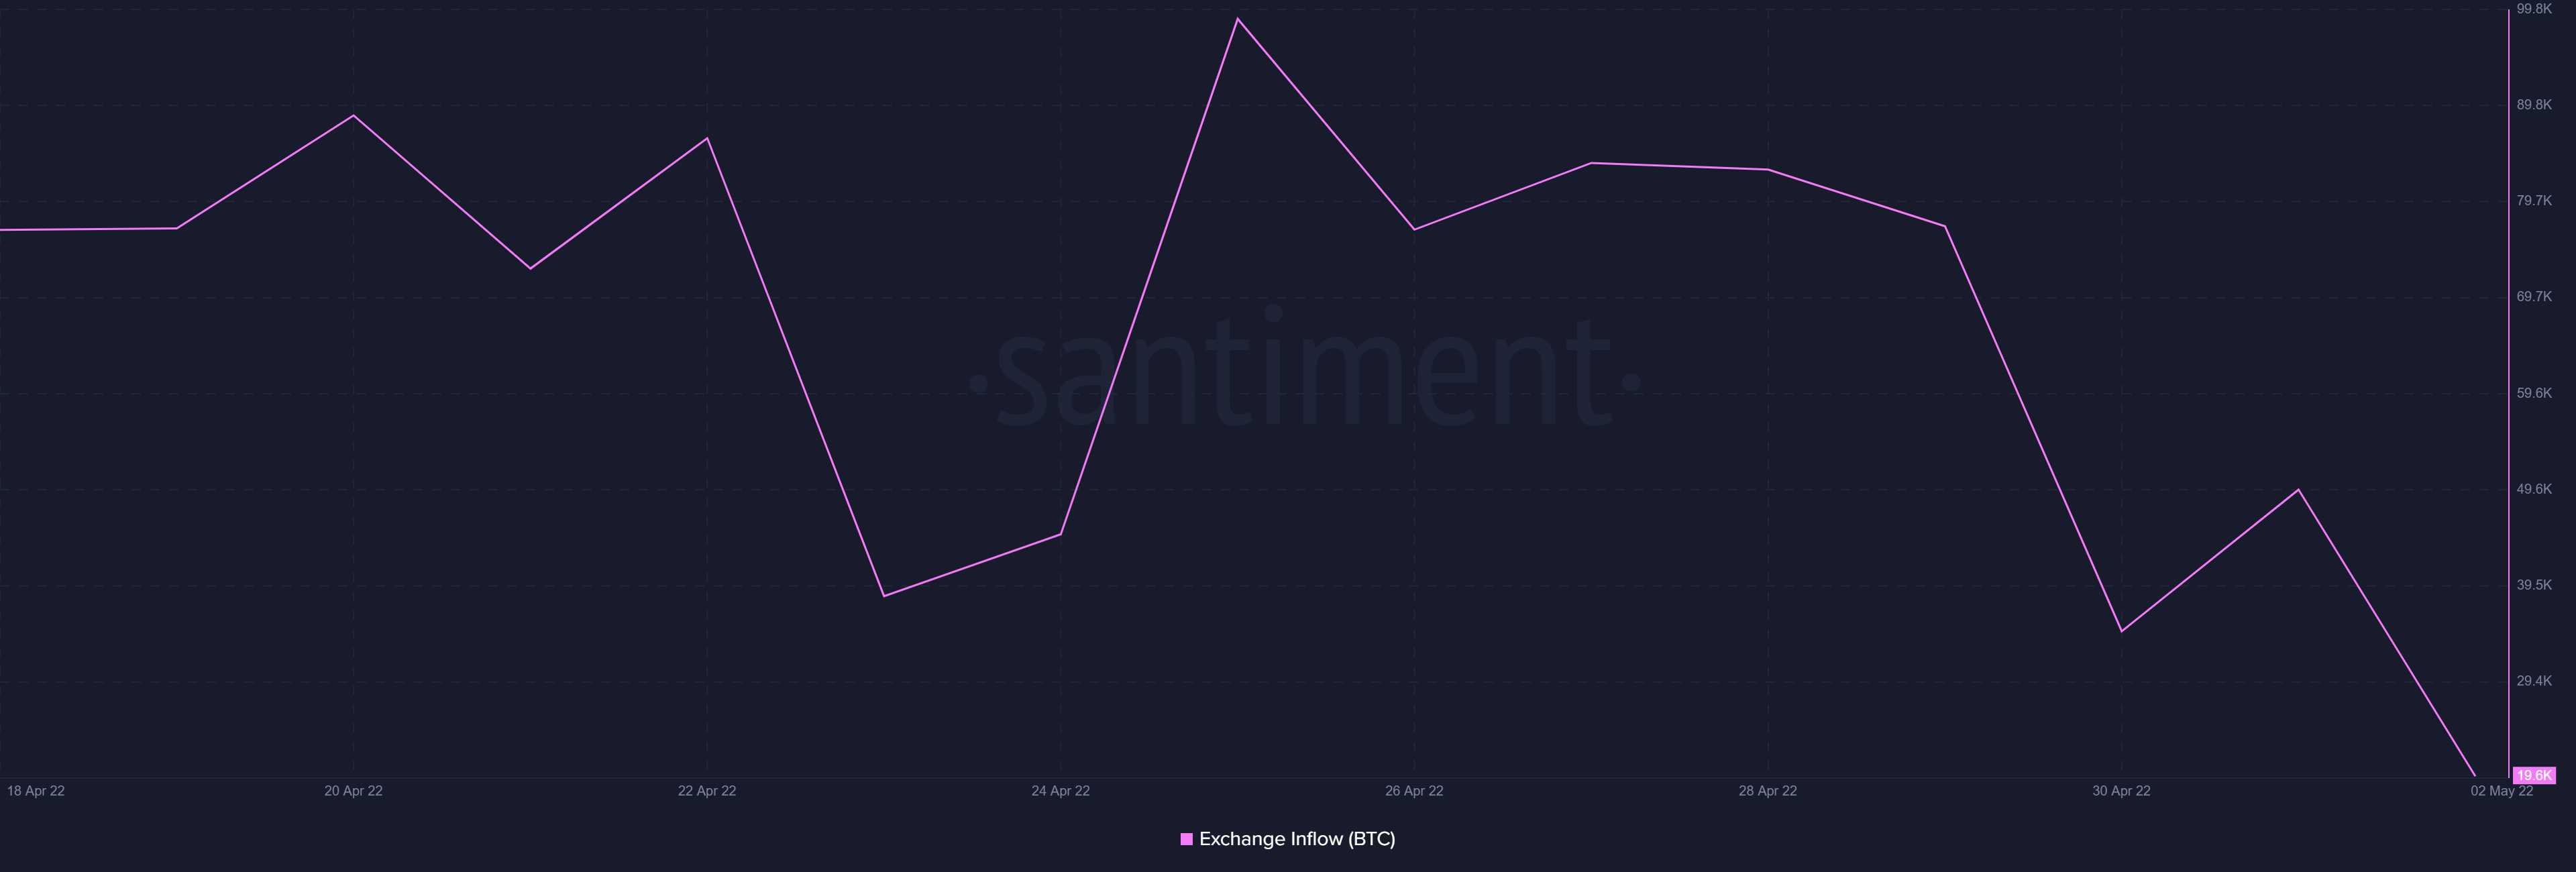
On the exchange front, a decline in Exchange Inflow was recorded in the last seven days. This represents a good signal as a spike in the Exchange Inflow for the coin would mean a spike in short-term sell pressure.
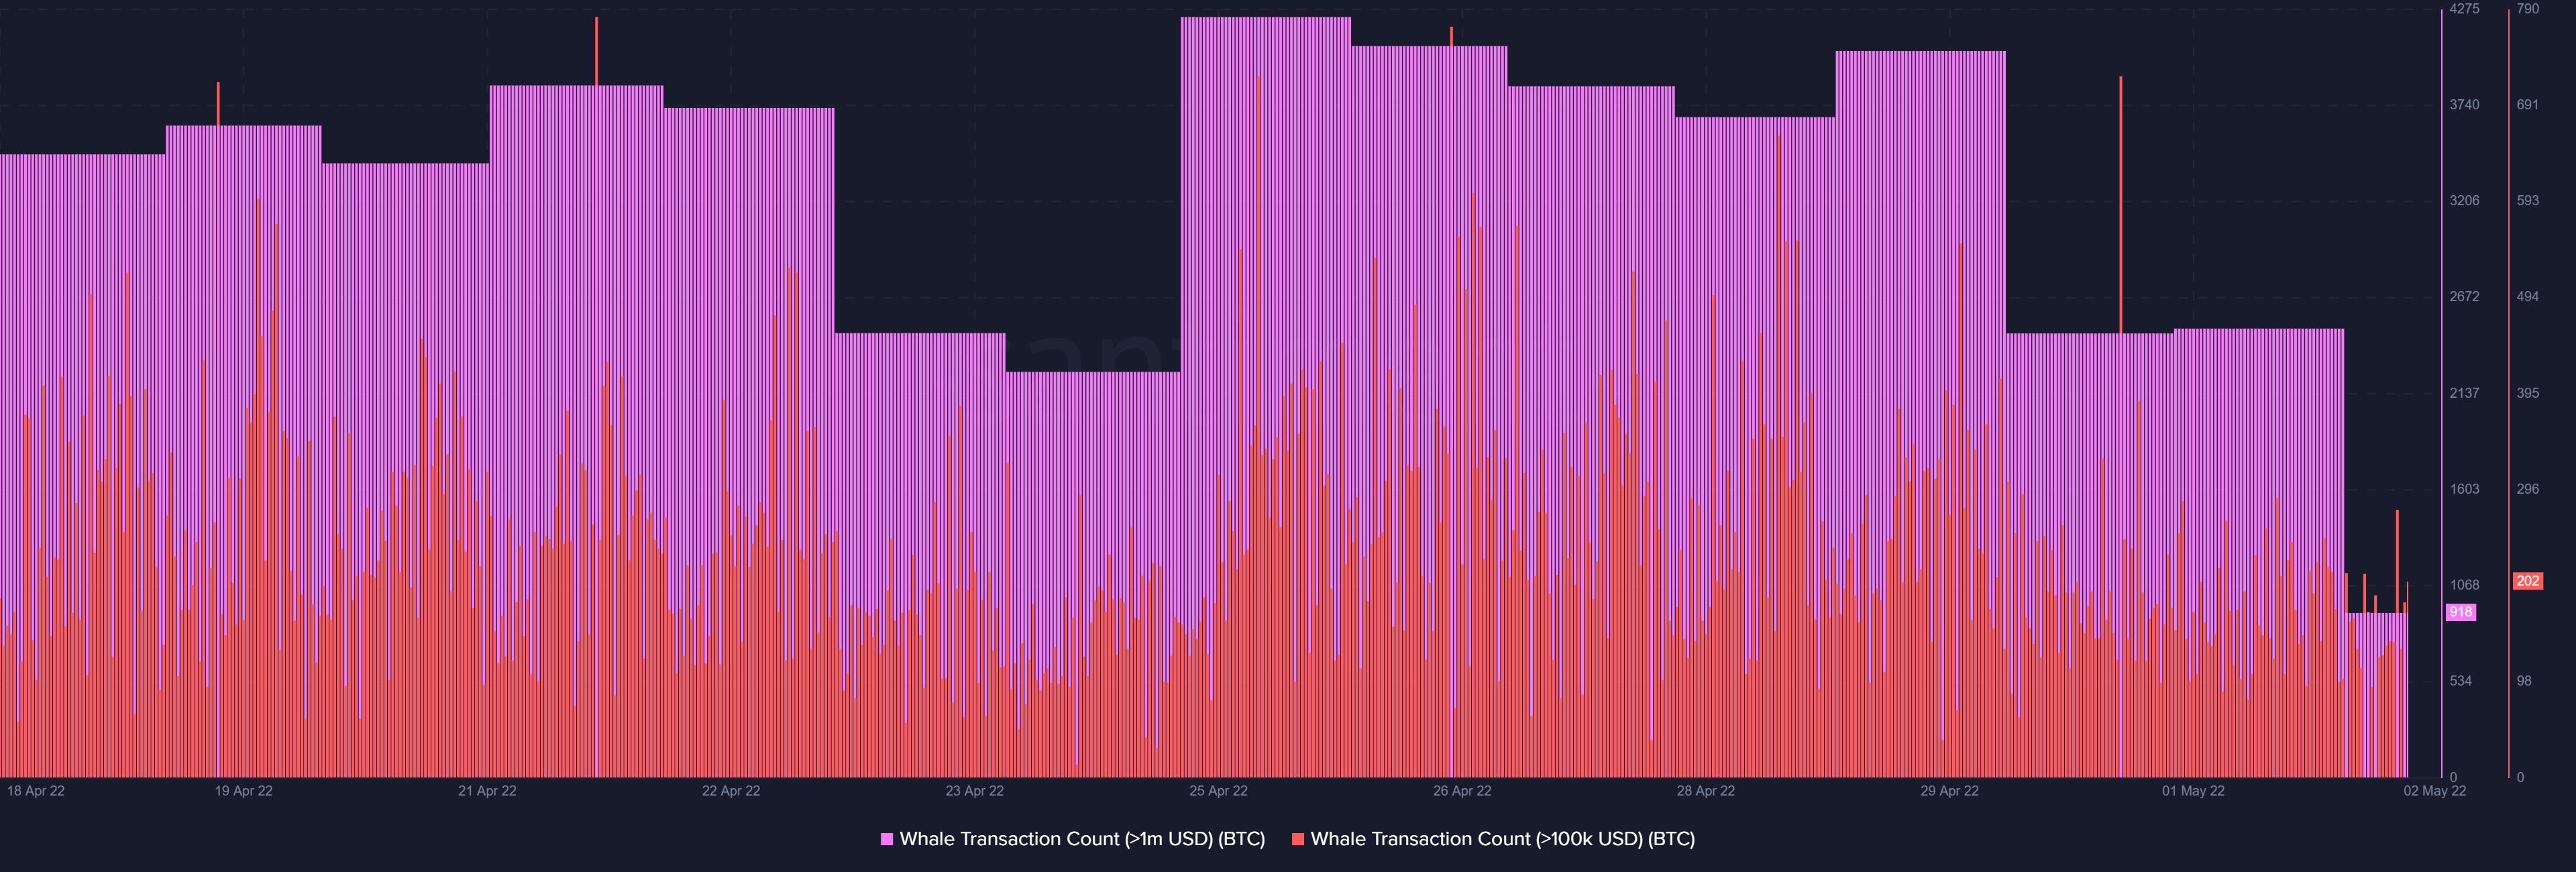
Further to this, in the last seven days, the whales appeared to have decreased accumulation as no significant spike in activity was recorded.
The 4-Hour Chart
In view of the above, will investors continue to remain bullish?
A consideration of the Price Chart on the 4-hour timeframe revealed that the price action formed a Descending Triangle. This is indicative of a bullish reversal pattern at the breaking point. Should this happen, it is possible for the coin to test new highs at the $42k region or higher.