With Bitcoin negating bearish setup, could $53,000 be in its crosshairs

Disclaimer: The findings of the following analysis are the sole opinions of the writer and should not be taken as investment advice
Bitcoin is in the middle of a key ascension phase after battling past a bearish setup on its chart. After what were developing to be the most significant daily gains since 21 July, BTC’s jump triggered a domino effect across the altcoin market.
With healthy conditions spread across a variety of its indicators, Bitcoin welcomed speculations of a clawback to $53,000. A few near-term hurdles stood above the 23.6% Fibonacci level, but expect bulls to be in cruise control thereon.
At the time of writing, BTC was valued at $47,310, up by 10% over the last 24 hours.
Bitcoin 4-hour Chart
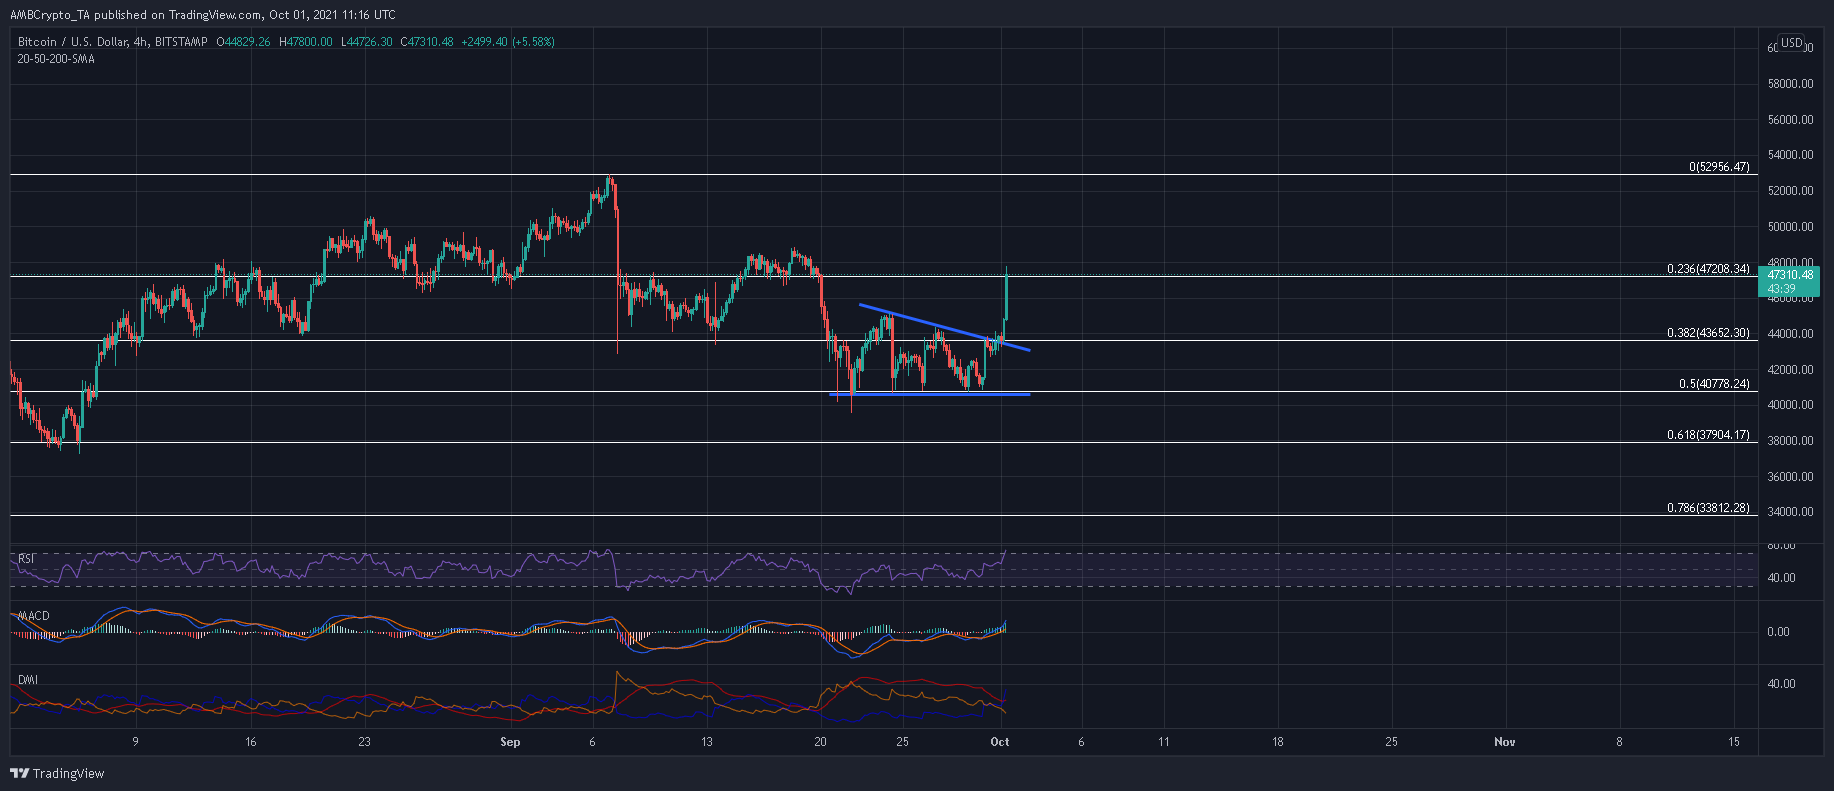
BTC’s bearish setup came via a descending triangle setup within the golden Fibonacci Retracement zone. After a fifth attack at the bottom trendline was defended, buyers found the legs for a breakout in the opposite direction. This was all but confirmed once BTC closed above the 38.2% Fibonacci level on strong volumes.
Based on the swing highs and lows within the pattern, a 9.9% surge can be expected from the breakout point at $43,500. This would push BTC above $48,000 after negotiating past a double top setup. From there, BTC would face little to no hurdles clawing back to $50k due to the lack of strong resistance levels.
A close above $53,000 on strong volumes would even open the doors to $60,000, but expect some fightback from sellers at $58,350.
In order to make this ascension, BTC needs to register a daily close above its 23.6% Fibonacci level. As mentioned previously, Bitcoin would also need to shrug past a double top around $49,000. If sellers regain control below $47,000, expect sharp countermeasures.
Reasoning
BTC’s indicators presented a buffet of buy signals. The MACD extended movement above the half-line after noting a bullish crossover yesterday. The Directional Movement Index’s +DI gained more distance on the -DI – A sign that BTC’s uptrend was gathering pace.
However, the relative Strength Index’s push into overbought territory presented chances of a near-term decline before the next leg upwards.
Conclusion
Bitcoin paved a way towards $53,000 after breaking north of its descending triangle. Although its path forward is not void of challenges, buyers have laid the building blocks for an extended push.
Based on how BTC interacts with the $53k price ceiling, a comeback to $60,000 is possible over the coming weeks.