XRP, Algorand, Zcash Price Analysis: 21 February

XRP formed a triangle pattern that could see a breakout to the upside provided the bulls in the market hold strong at the $0.5 region. Algorand failed to move past $1.42 and was headed lower on the charts, while Zcash showed a drop to $150 is likely.
XRP
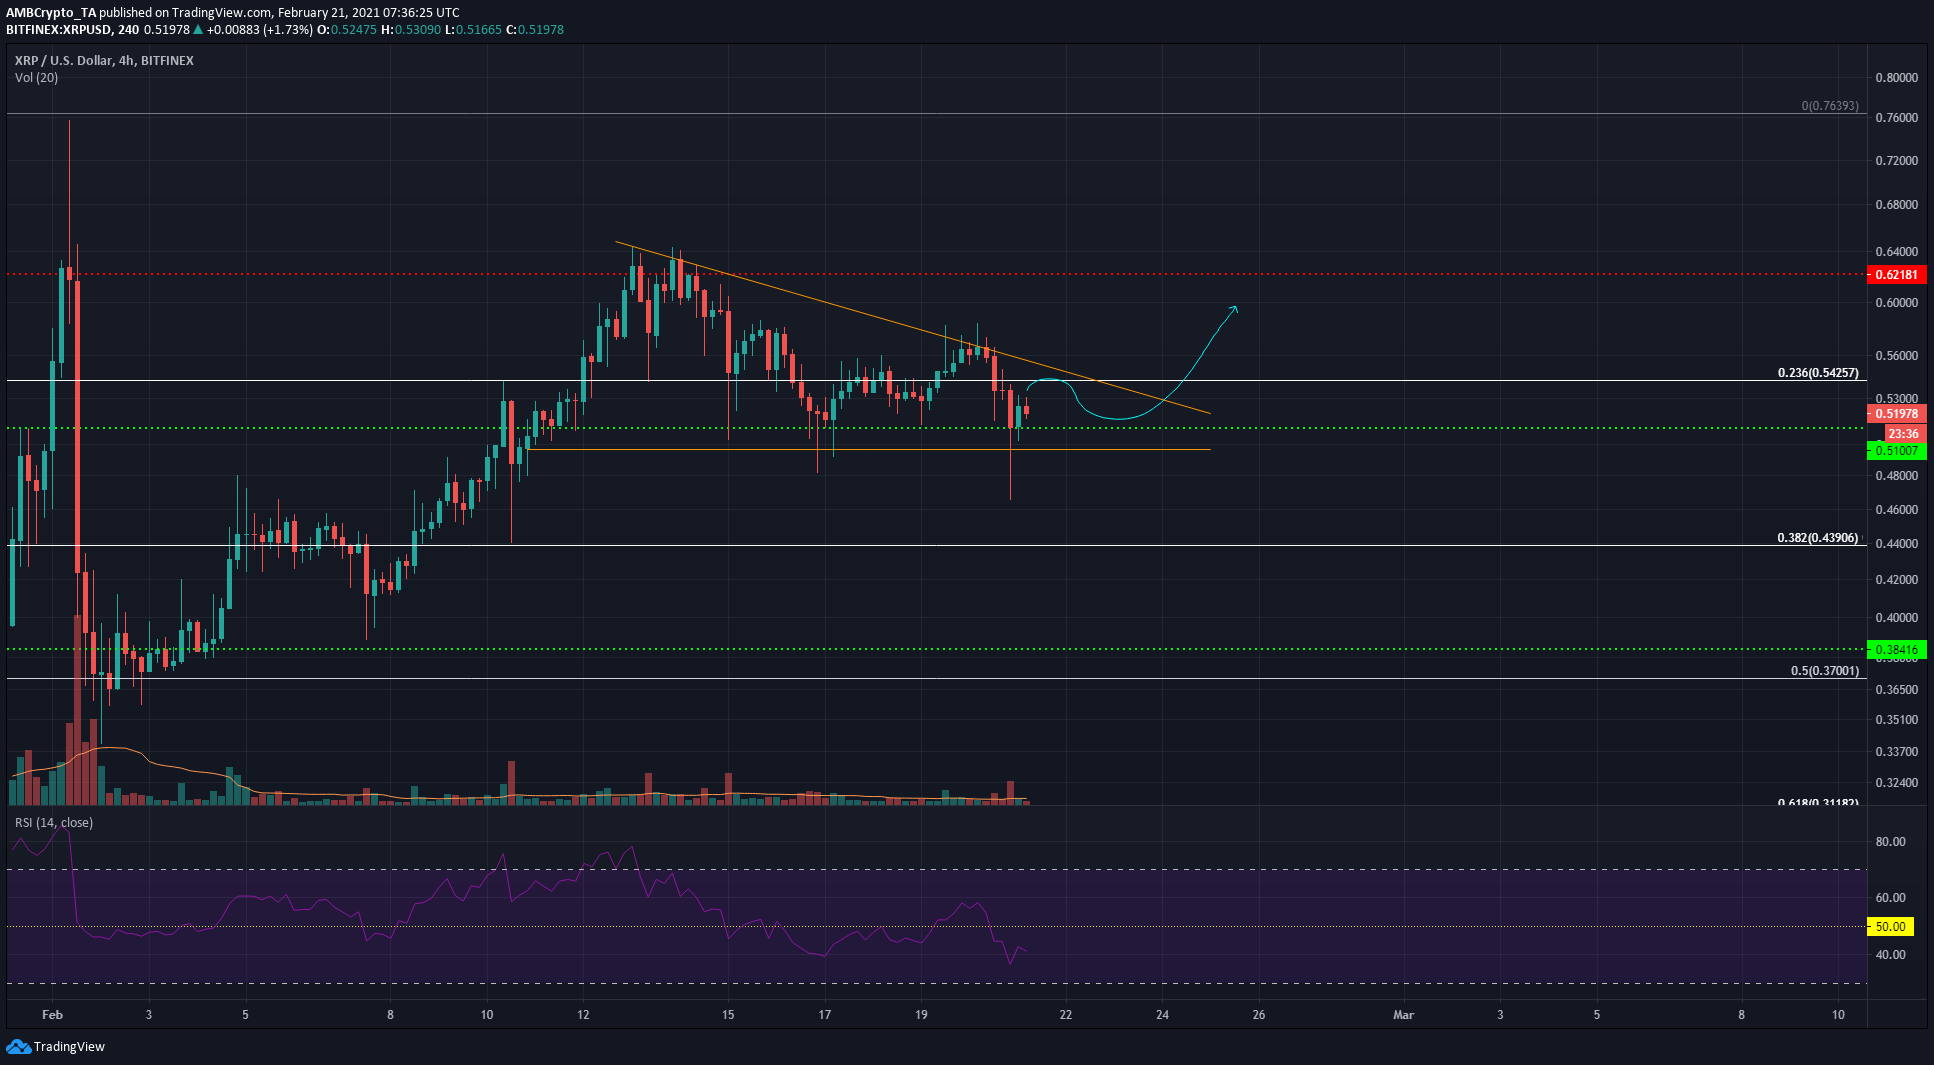
XRP formed a descending triangle pattern and was valued at $0.519 at the time of writing. The Fibonacci retracement level overhead at $0.54 has been flipped to resistance.
Highlighted in cyan is a possible route for XRP prices over the next few days. Invalidation of this idea would be XRP breaking beneath the $0.49 mark with strong volume. A retest of the $0.51 level as support is likely in the coming hours, as the RSI slid below neutral 50 to denote rising bearish pressure.
If a breakout is seen, the $0.6 region would be a target for the bulls.
Algorand [ALGO]
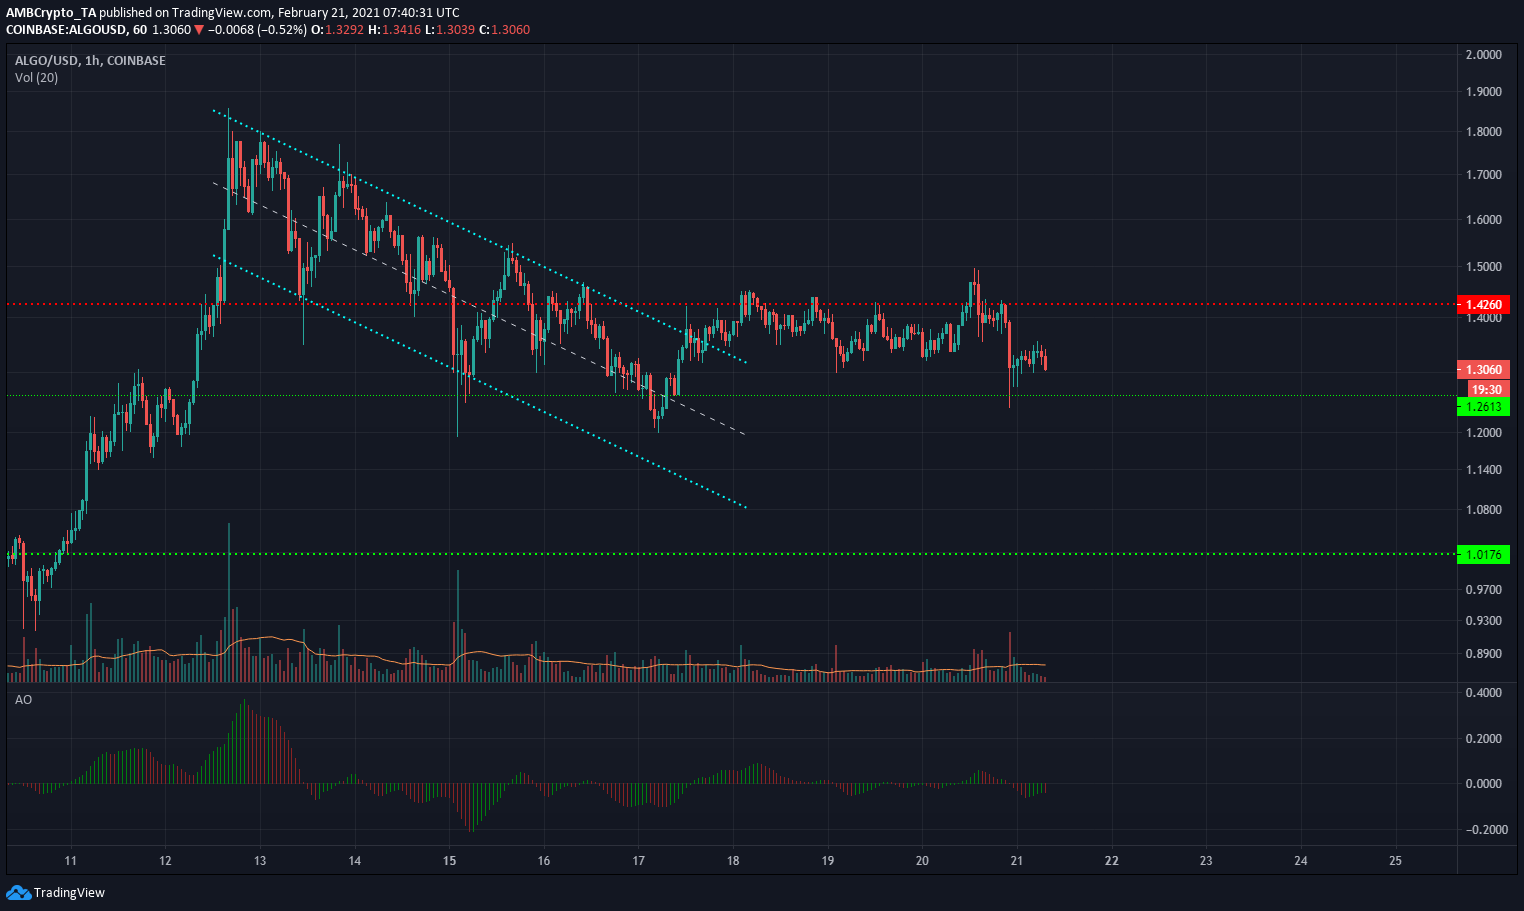
Algorand appeared to form a bull flag on the larger timeframes as the descending channel (cyan) forms the flag. However, this was not the case for the price. ALGO met heavy resistance at $1.42 and was unable to scale this level.
It was instead pushed lower toward $1.26 as bears took control of the market at $1.42 in the recent past. The Awesome Oscillator was moving beneath the zero line to indicate bearish momentum. Losing the $1.26 level and $1.2 could see ALGO retrace all the way back to $1.
Zcash [ZEC]
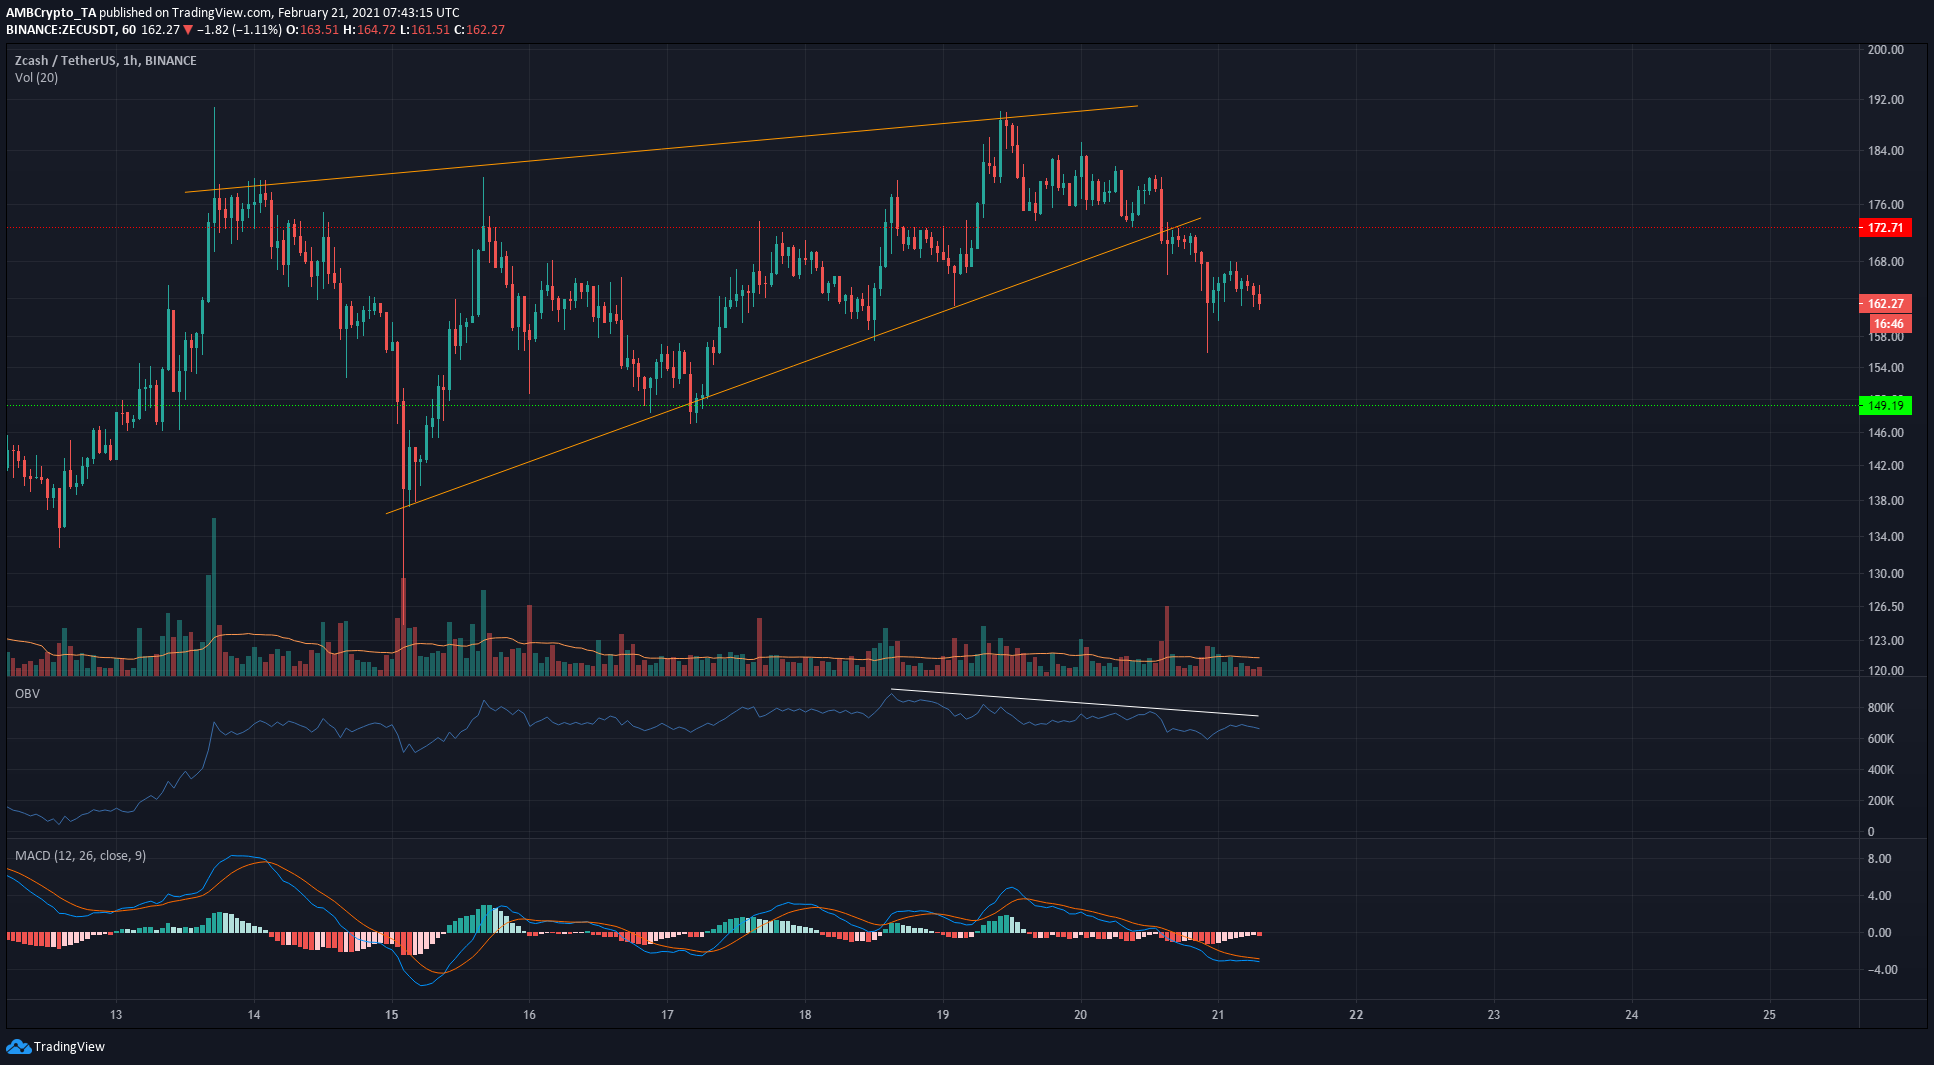
ZEC formed a rising wedge and slid beneath the pattern to indicate a move back to the base of the pattern in the $140 area. The MACD has been moving steadily lower over the past few days.
The level of former support at $172 was retested as resistance to confirm a move to the downside. The $158 mark could stall ZEC’s descent, but likely not for long. The OBV showed that sellers have actually made a small dent in the past few days.
The selling volume was a fraction of the buying volume on the rally upward, but it does show that recent selling has some legitimacy. The $149 level is expected to act as a support.