XRP, Avalanche, Polkadot Price Analysis: 26 March

The altcoin market posted remarkable gains in the past week, but many hit resistance levels on their own charts as Bitcoin also stalled in a resistance zone. A pullback before another leg upwards appeared likely for Avalanche, while XRP continued to be in an uptrend.
XRP
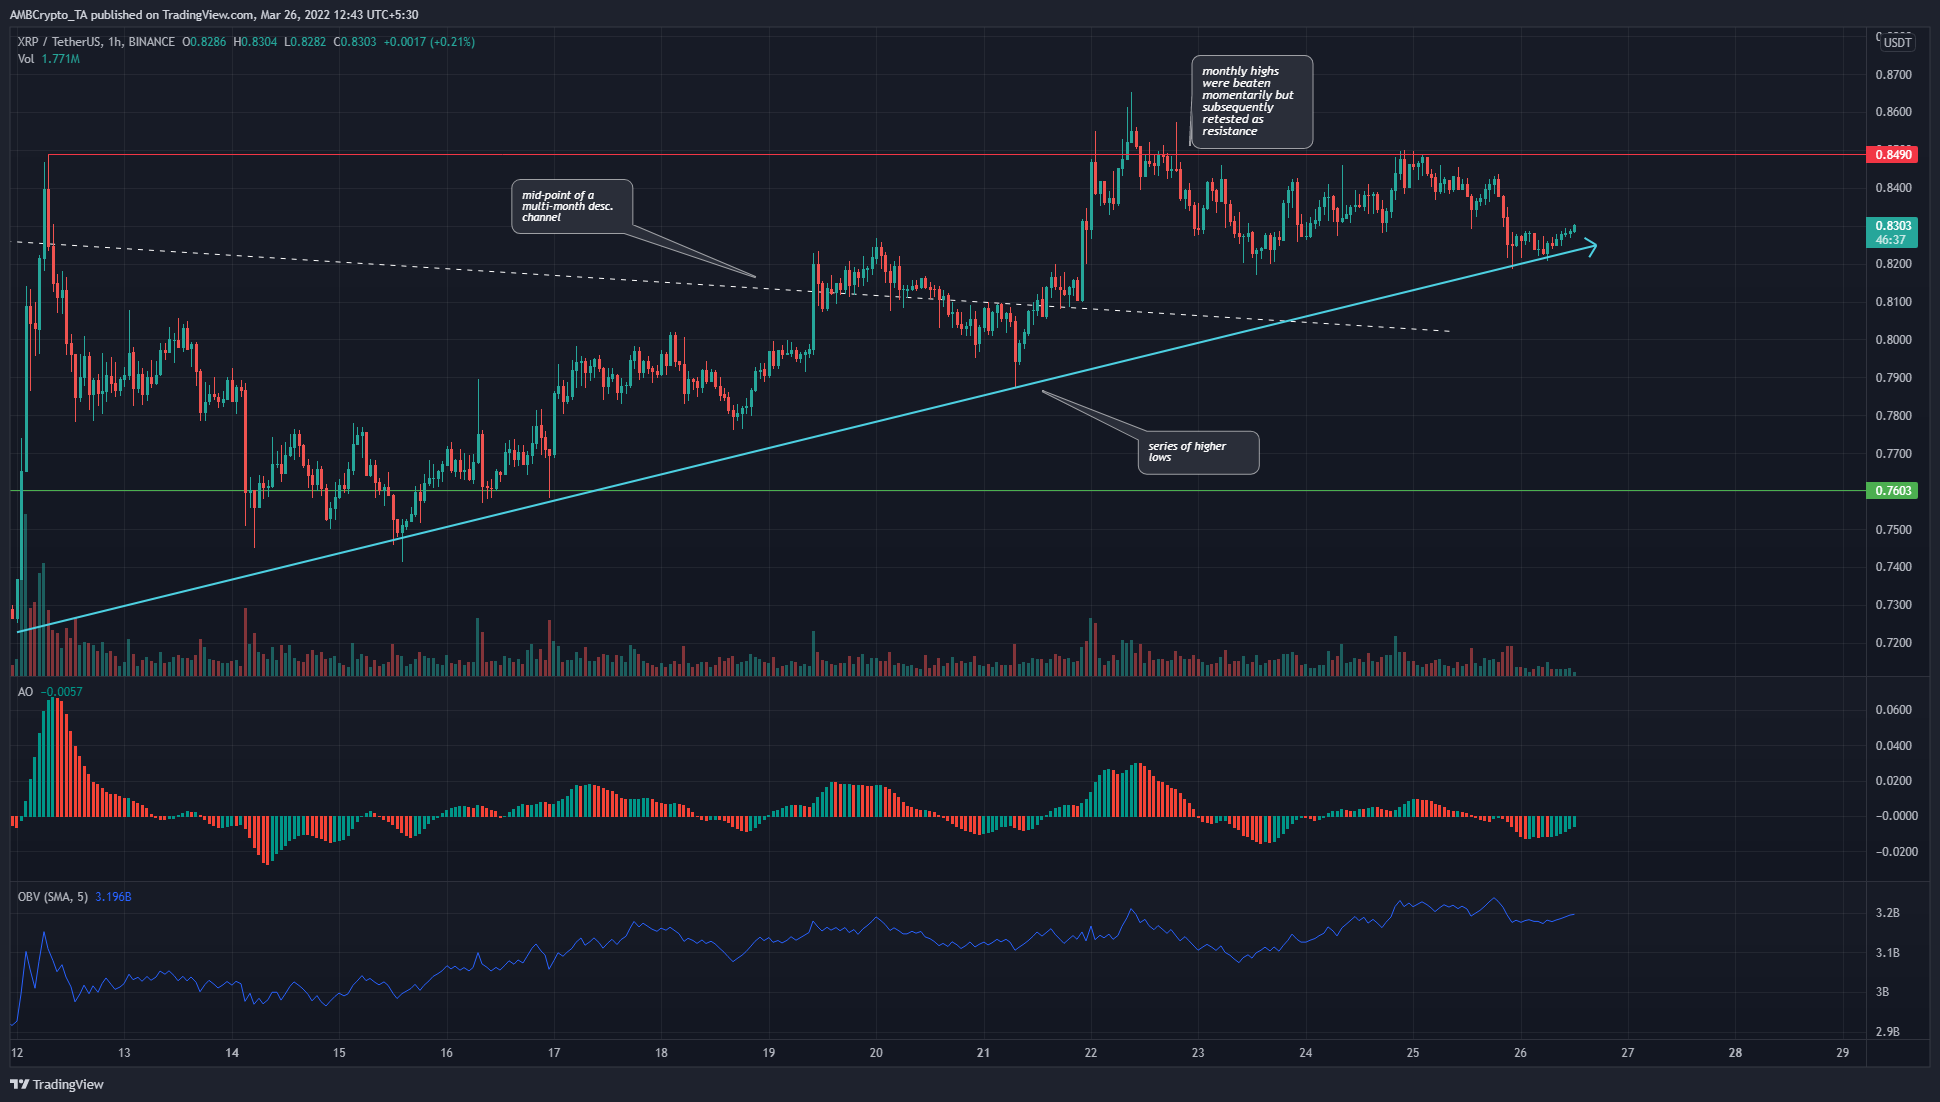
In the past few days, XRP has registered a series of higher lows on the charts to suggest an uptrend on the lower timeframes. Moreover, the price managed to climb past a long-term channel’s mid-point (dotted white) to indicate that further upside could be seen in the weeks to come.
The $0.849 resistance level represents the highs of the month of March- and XRP did climb past these highs. Even though it was unable to hold on to the level, it was still a bullish development. The Awesome Oscillator was beneath the zero line in response to the selling of the previous day. The OBV has been climbing steadily (higher lows) and highlighted the presence of buying volume.
Avalanche (AVAX)
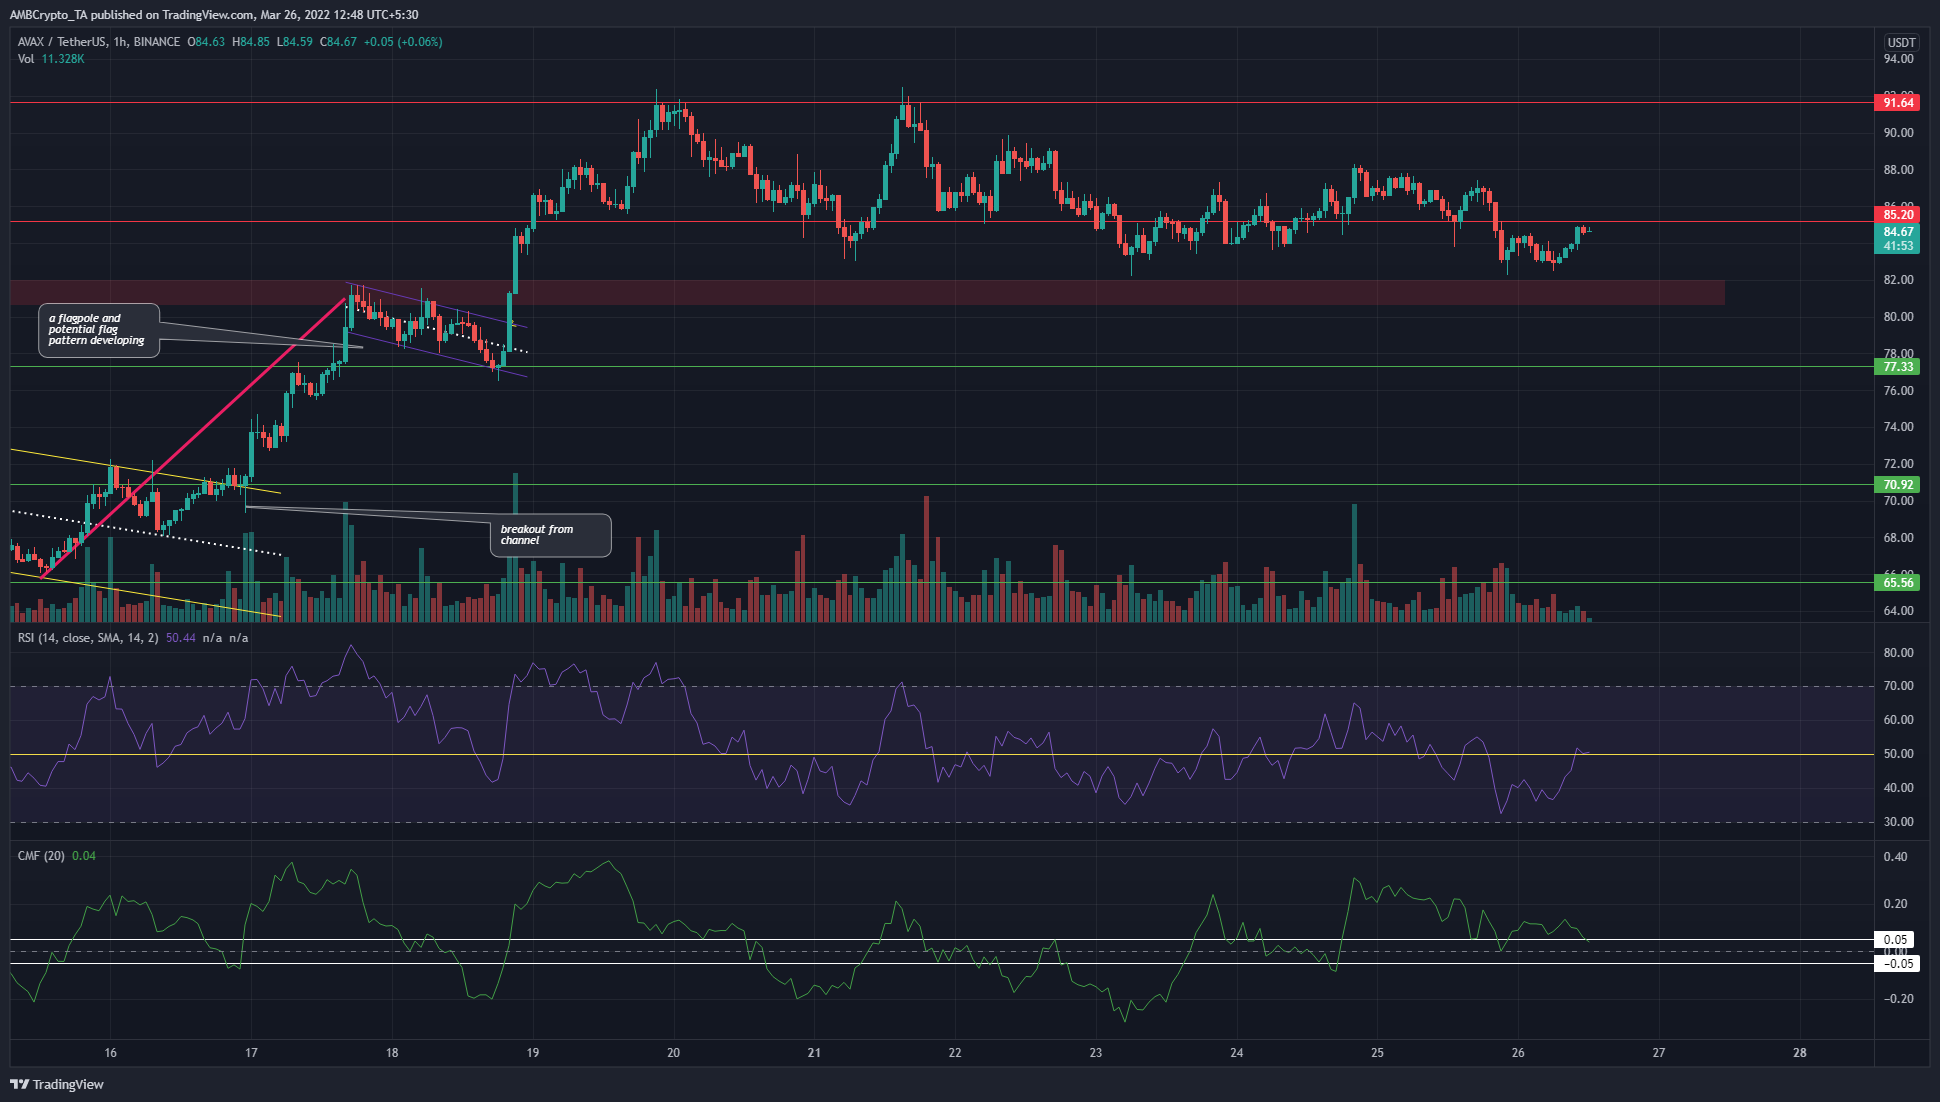
Following the breakout from the bullish flag, AVAX climbed from $80 to $91. However, in the past week, the price has found the $91.6 level to be an obstinate resistance level. In the past few days, the price has descended beneath the $85.2 level as well and could be headed toward the $81 area to test it for demand.
The RSI slipped beneath neutral 50 and appeared to be on the verge of retesting it as resistance before dropping once more, which would show a short-term downtrend in progress. The Chaikin Money Flow also dipped beneath +0.05.
Polkadot (DOT)
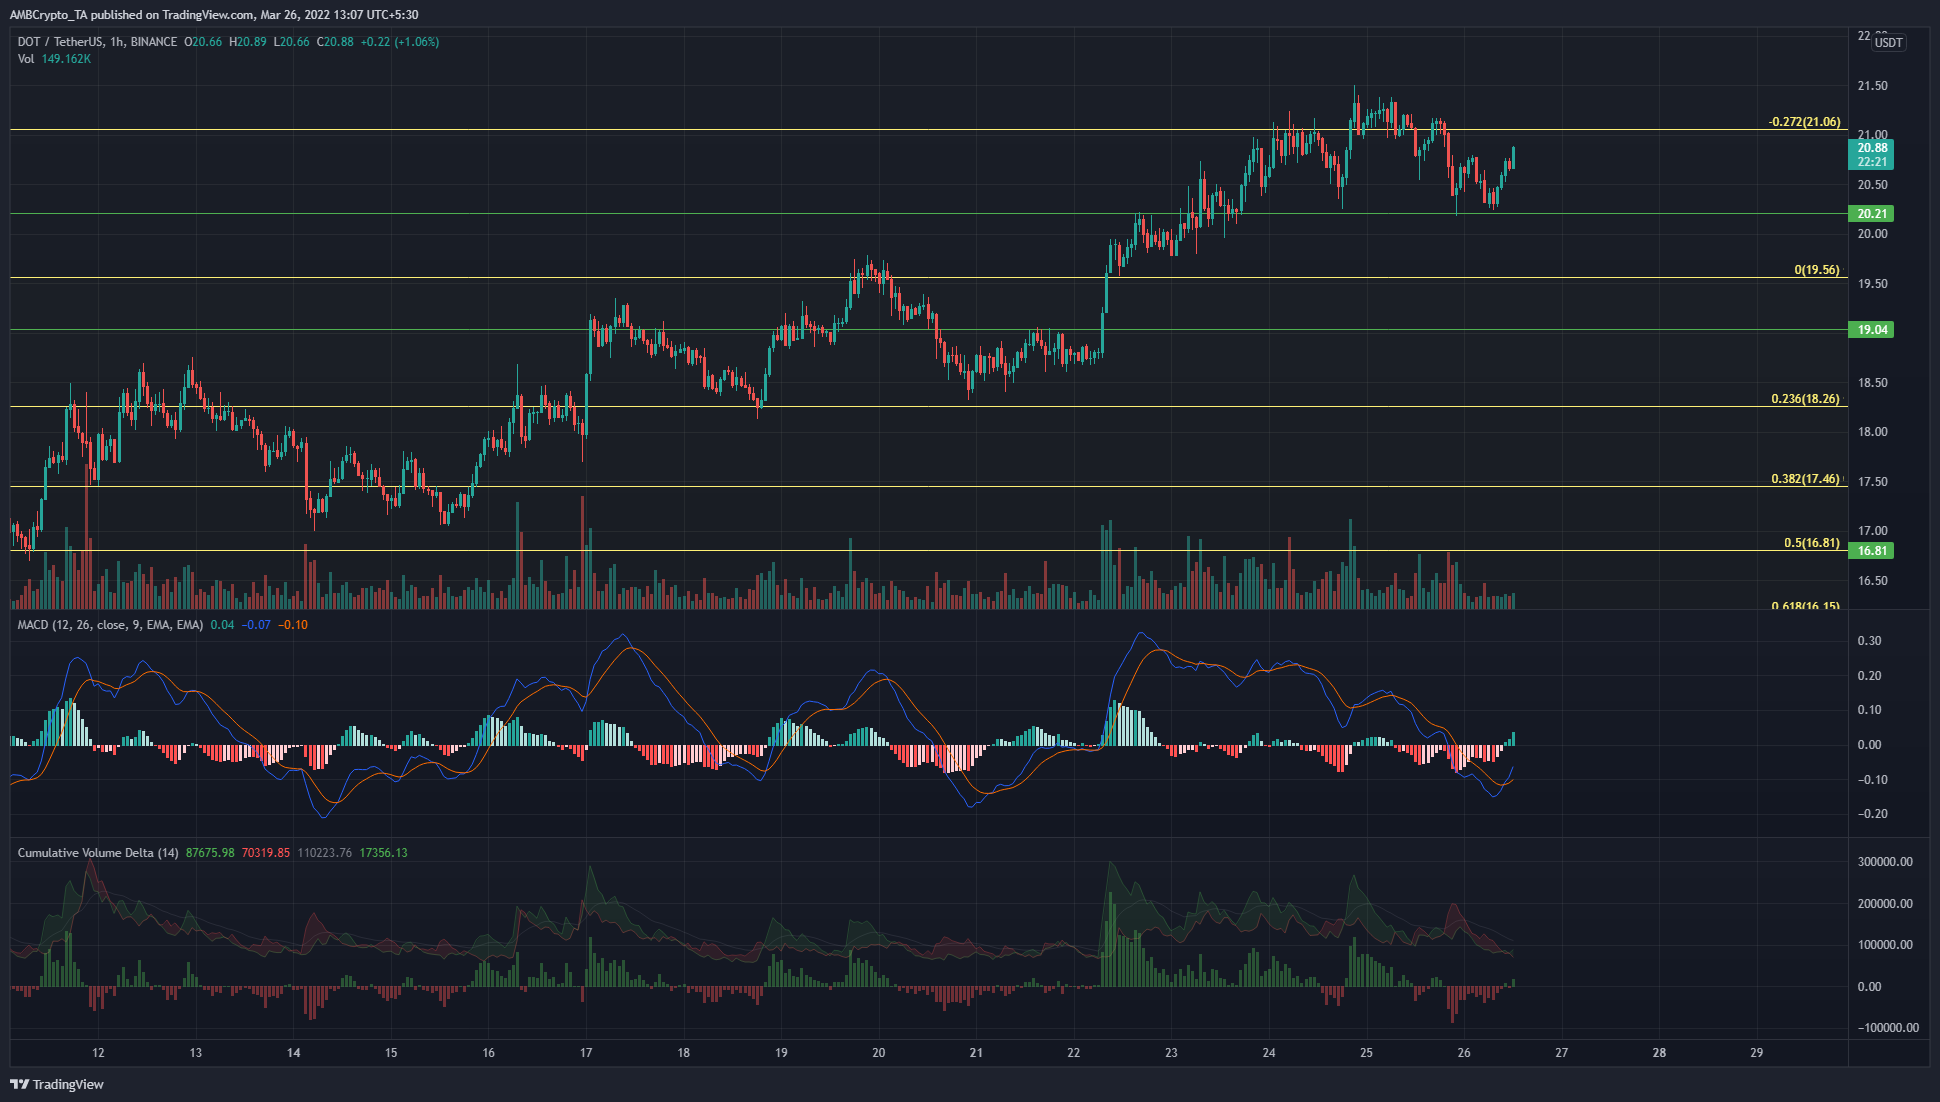
In late February, Polkadot saw a sharp bounce from $14.05 to $19.56. Based on this move, a set of Fibonacci retracement levels (yellow) were drawn. At the time of writing, the price had been rejected from the 27.2% extension level at $21. The $21-$21.3 area was still in bearish hands, but this could change, and DOT could push higher toward the next extension level (61.8%) at $23.
Even though the MACD was below the zero line, it formed a bullish crossover and could see $21 retested as resistance once more. The CVD also appeared to flip from selling to buying pressure.


