XRP, Chainlink, Litecoin Price Analysis: 06 November

The altcoin industry observed a plunge as the prices dipped for the majority of the alts. As a result, altcoins like XRP, Chainlink, and Litecoin noted losses on their daily charts.
Near-term technical indications for all the above alts suggested a decreasing buying momentum and favored the sellers.
XRP
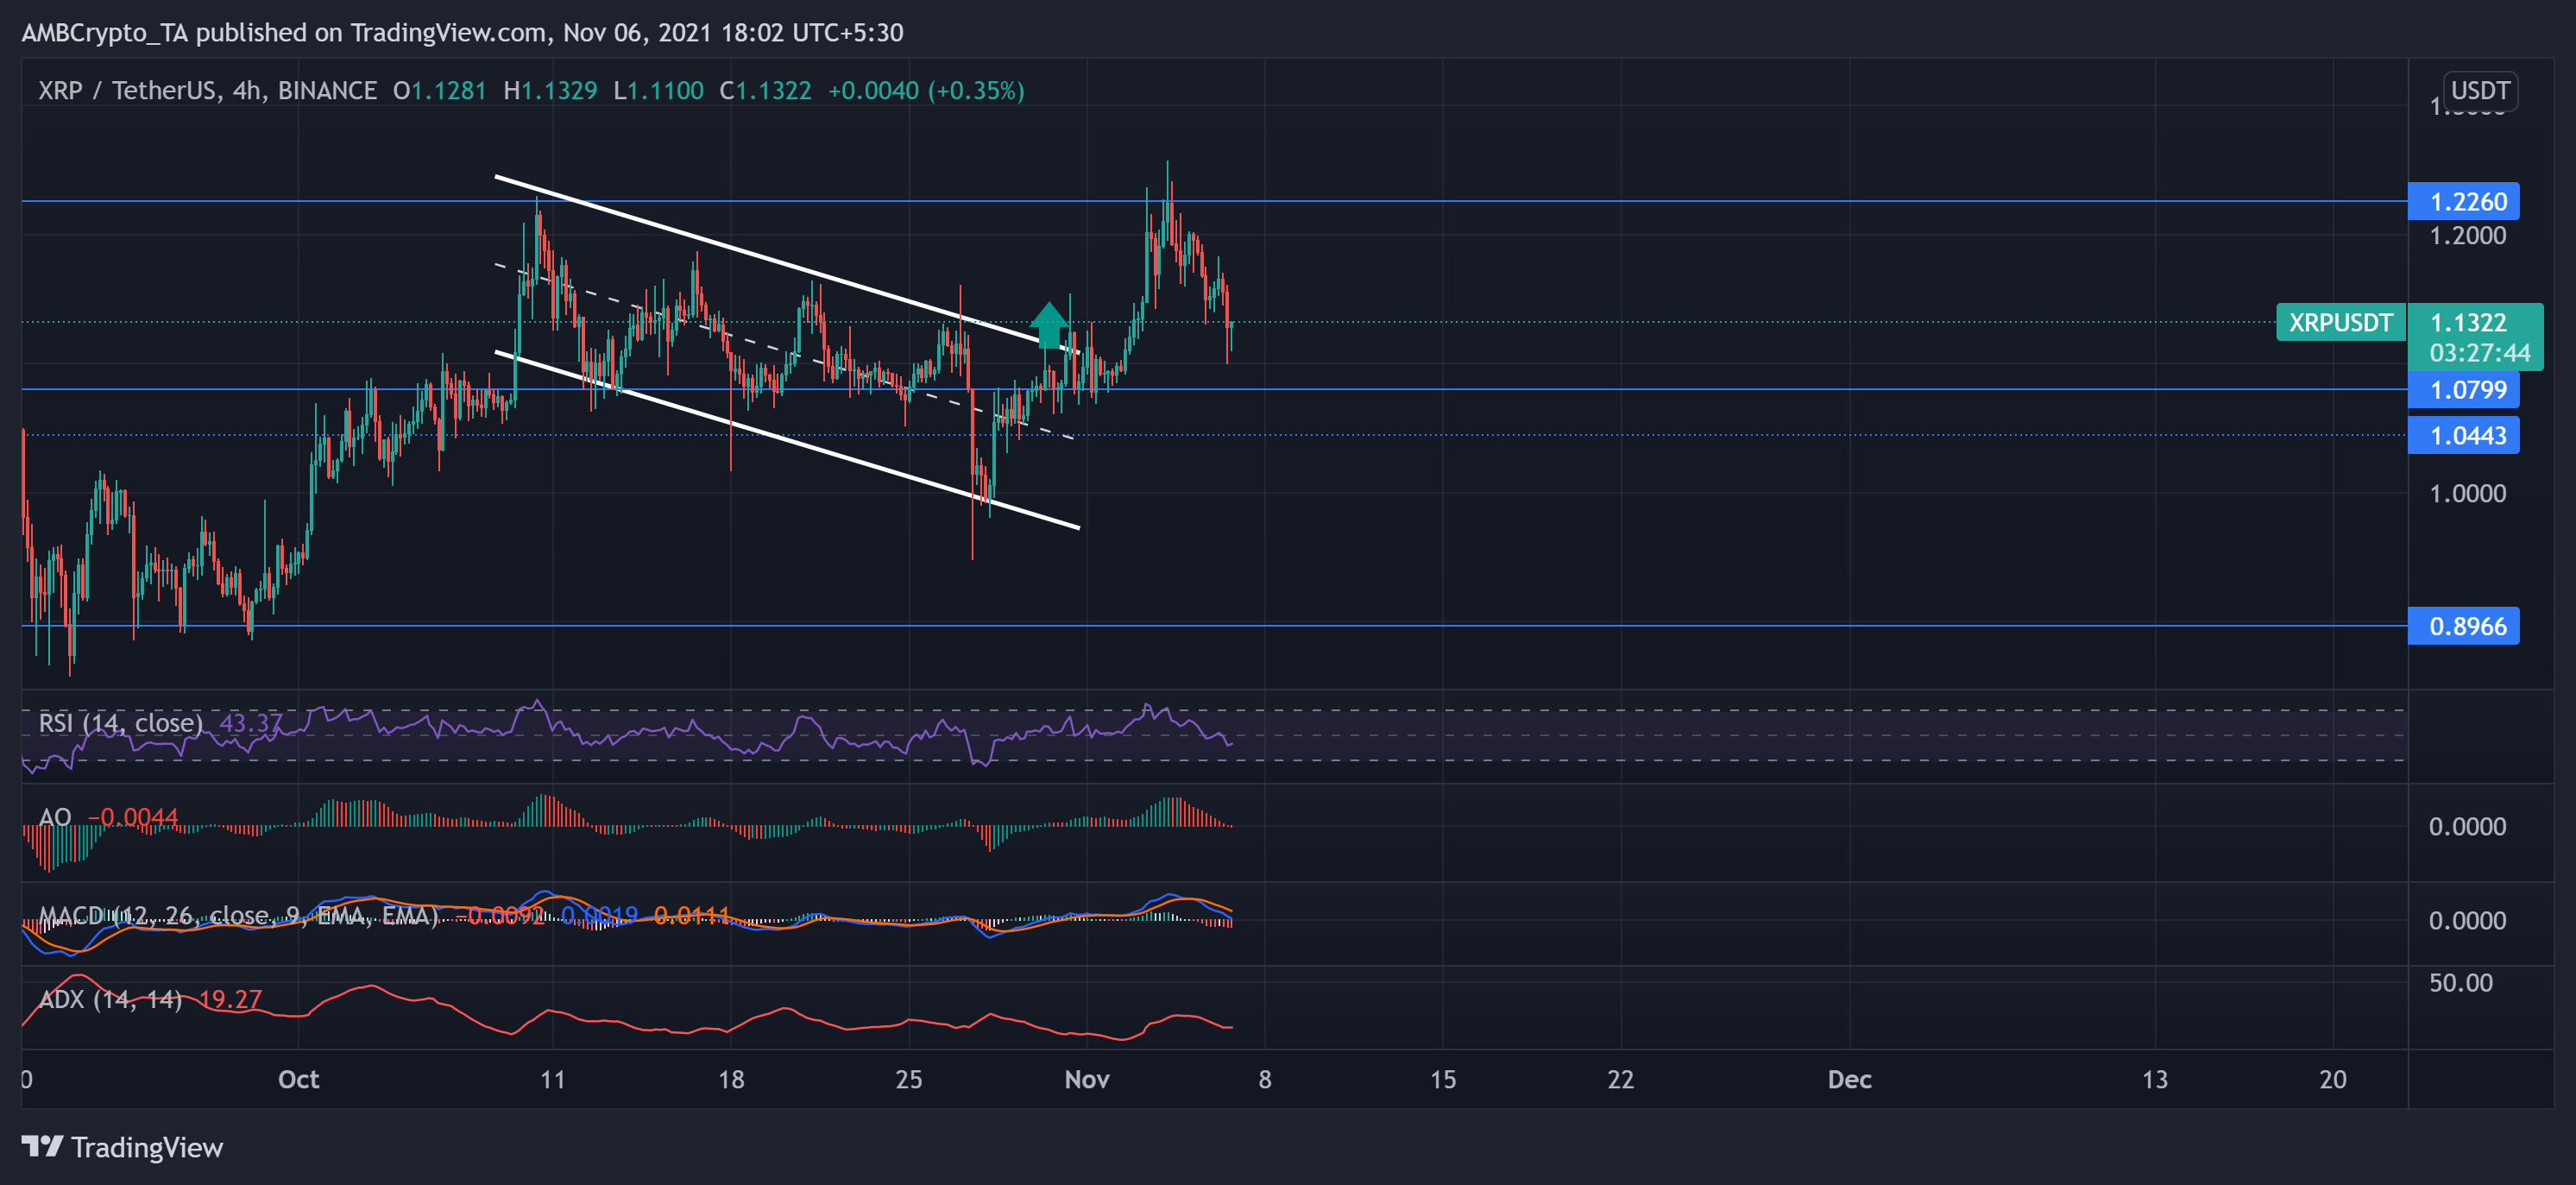
XRP oscillated in a downtrend between two parallel lines heading south until last week. Quickly after this, XRP bulls triggered an uptrend as the price witnessed a nearly 3% Weekly ROI. As a result, the price touched its two-month high on 4 November. Subsequently, the price action witnessed a pullback. As a consequence, the digital currency noted a 4.5% loss in the past 24 hours and traded at $1.1322. XRP bears displayed resistance at $1.2260 while the bulls exerted constant pressure.
The near-term technical indicators pointed at decreasing buying momentum.
Thus, the Relative Strength Index (RSI) rushed south after diving from above the midline. Additionally, MACD Histogram and the Awesome Oscillator (AO) flashed red signals and indicated decreasing buying power. However, the ADX line stood at the 19-mark, displaying a weak directional trend.
Chainlink (LINK)
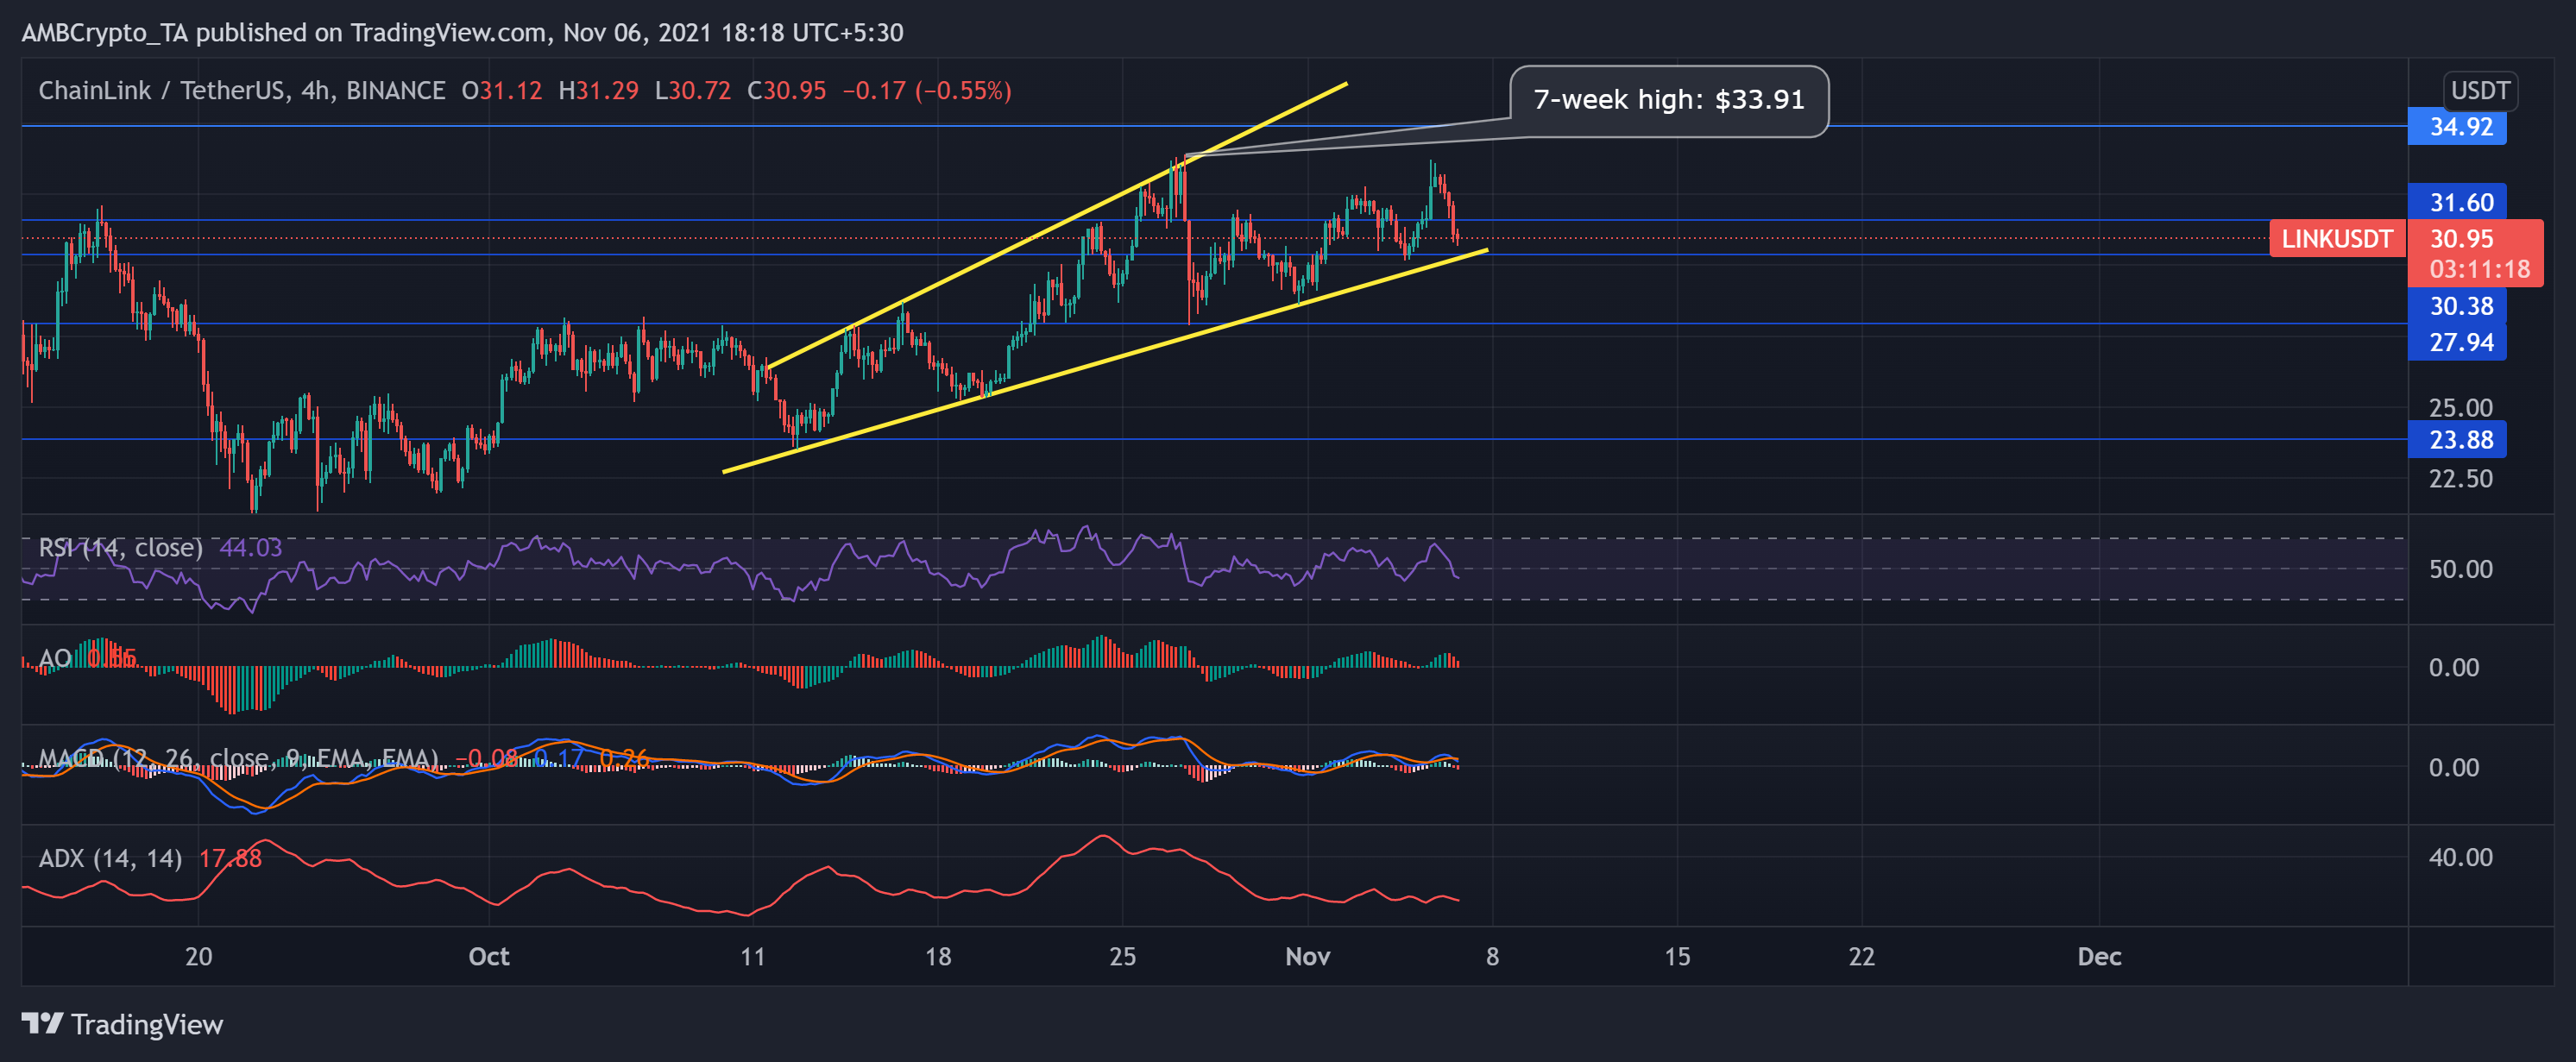
For the past three weeks, LINK assumed a steady uptrend by oscillating towards the north. The decentralized oracle network registered a 16.24% monthly ROI. As a result, LINK reached its seven-week high on 27 October at $33.91 and bounced back between the trendlines. Afterwhich, the alt hit its week’s low as the bears exerted sustained pressure.
The bulls displayed their power as the price gradually breached its immediate resistance at $31.60 and noted a 4.67% weekly ROI.
However, at press time, LINK traded at $30.95 after noting a 7.10% loss over the past day.
The near-term technical indicators showed a preference for selling strength as the Relative Strength Index (RSI) stood at the 44-mark. Additionally, the MACD lines depicted a momentum in favor of sellers, and the Awesome Oscillator (AO) revealed red signals. However, the ADX line was at the 17-mark, hinting at a weak directional trend.
Litecoin (LTC)
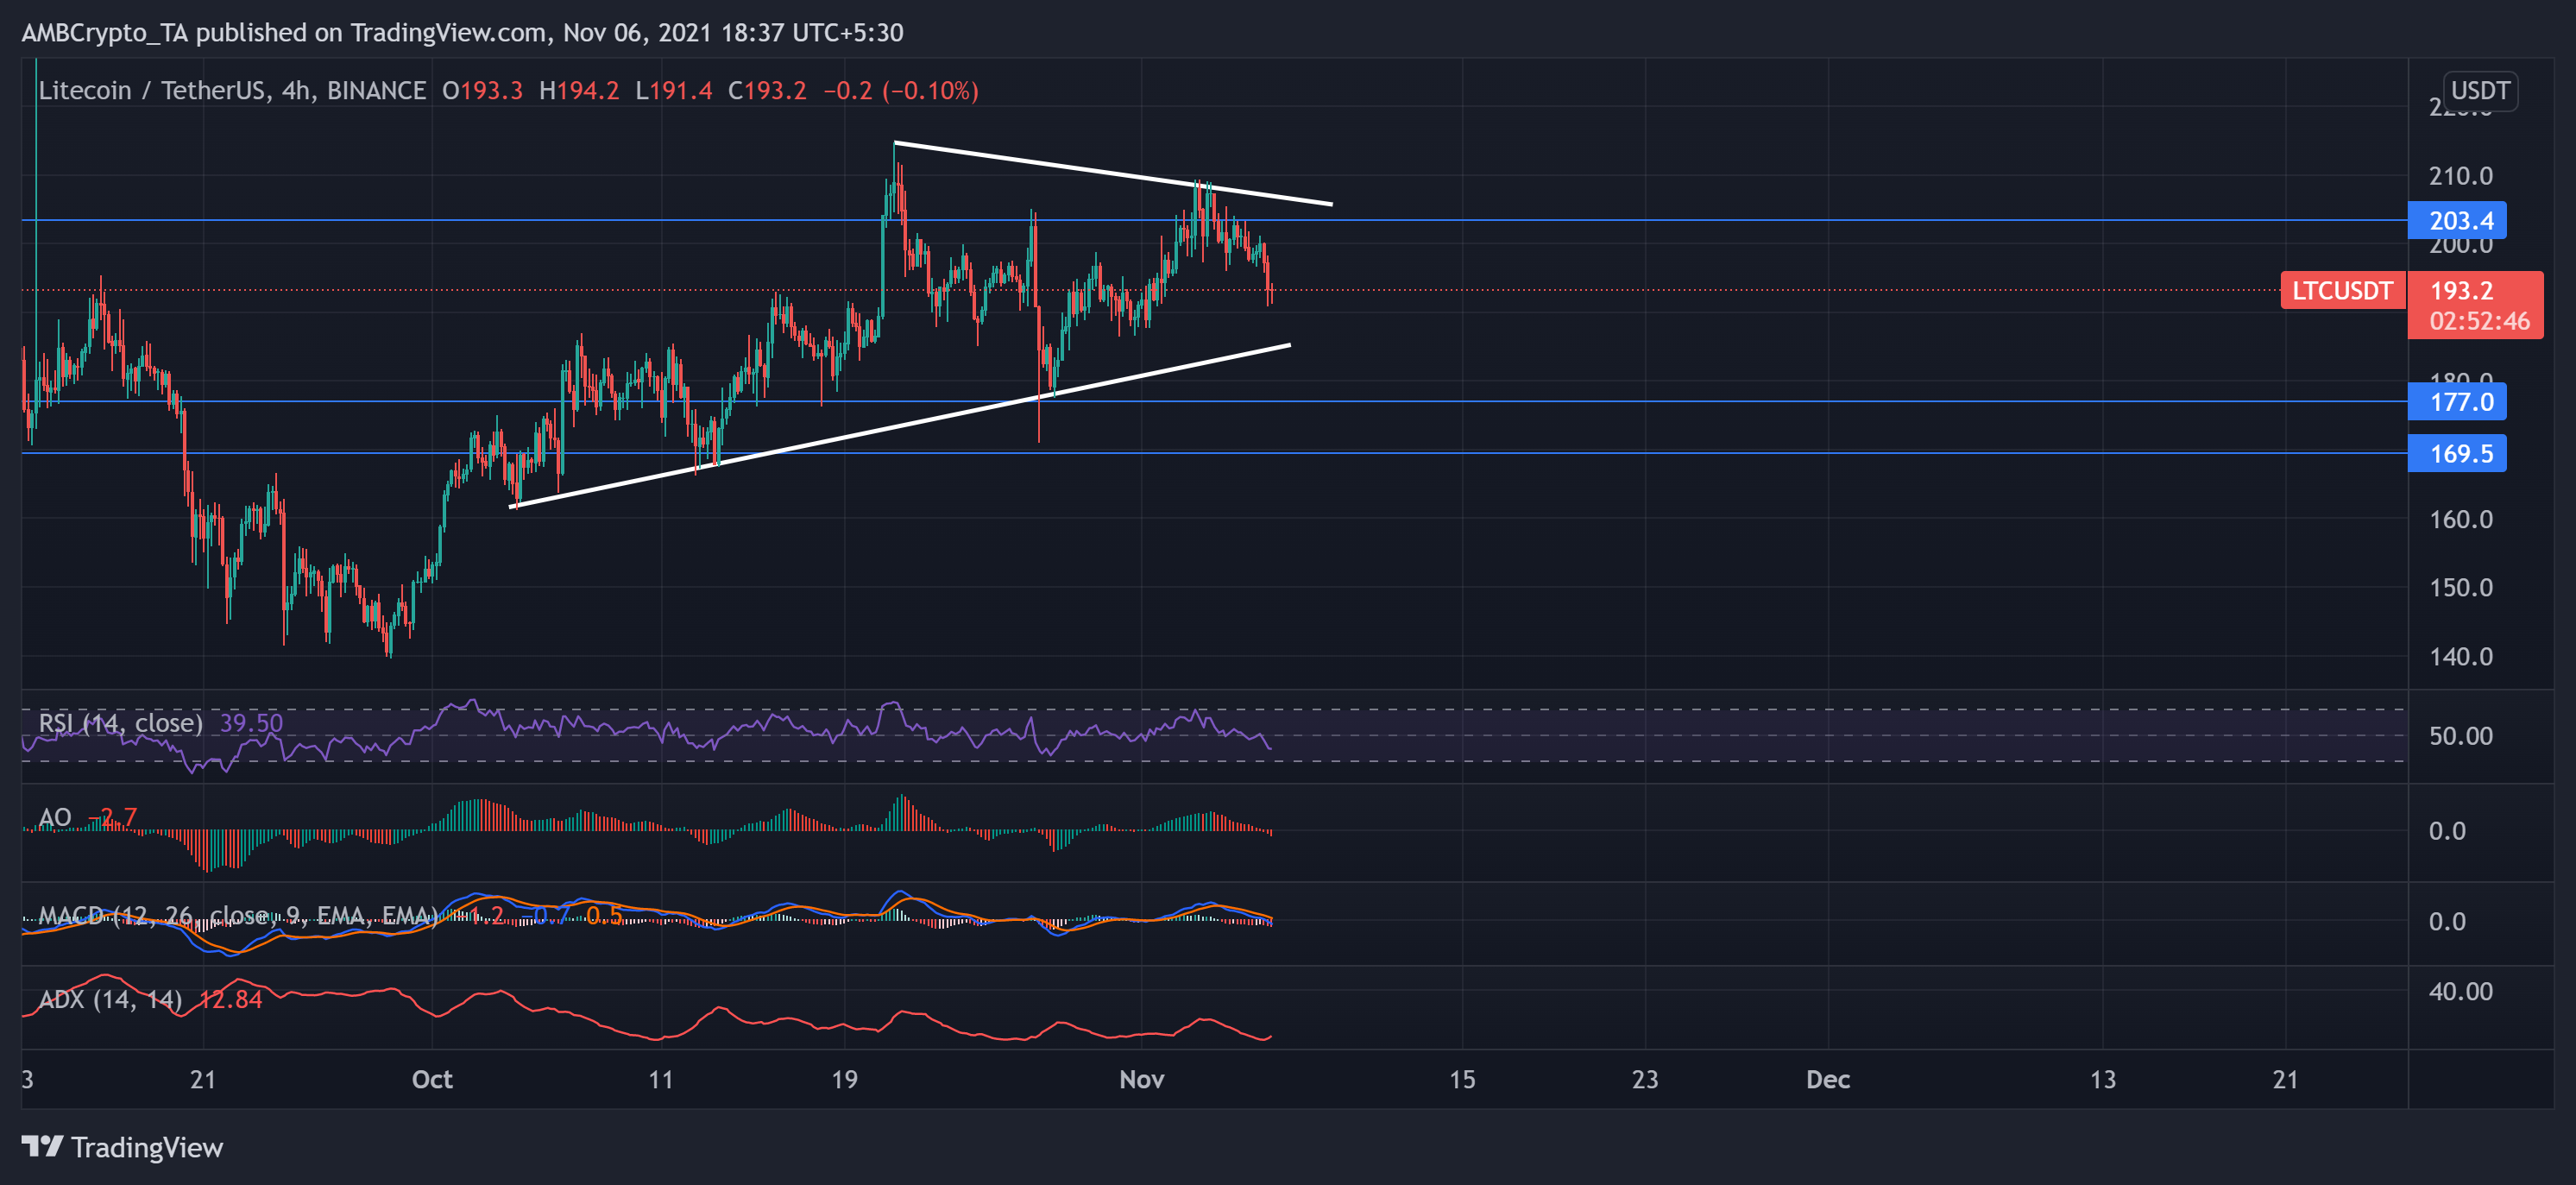
LTC displayed an overall bullish outlook over the last month as it oscillated in a steady ascending trend. As a result, its charts noted an 8.57% monthly gain. However, the price action witnessed a descent as it plunged to its two-week low on 27 October.
Nonetheless, the bulls exerted pressure and ensured support at $177. Now, if the bulls failed to sustain their pressure, bears aimed to push the support at $169.5. The altcoin traded at $193.2 and registered a 3.77% loss on its daily charts.
The RSI plunged from above the midline, indicating increasing selling strength. Moreover, the MACD histogram and the AO flashed red signals and resonated with decreasing RSI. Nevertheless, the ADX stood at the 12-mark, depicting a weak directional trend.