XRP continues its newfound uptrend but there are some conflicting signs

Disclaimer: The findings of the following analysis are the sole opinions of the writer and should not be considered investment advice
XRP climbed past a descending trendline resistance that has been in play since August. A recent report highlight how on-chain volume had been relatively low, despite the uptick in price. A technical indicator also reflected similar divergences between itself and the price. Does this mean XRP could halt, or will the situation change and demand arrive in the weeks to come?
XRP- 1D
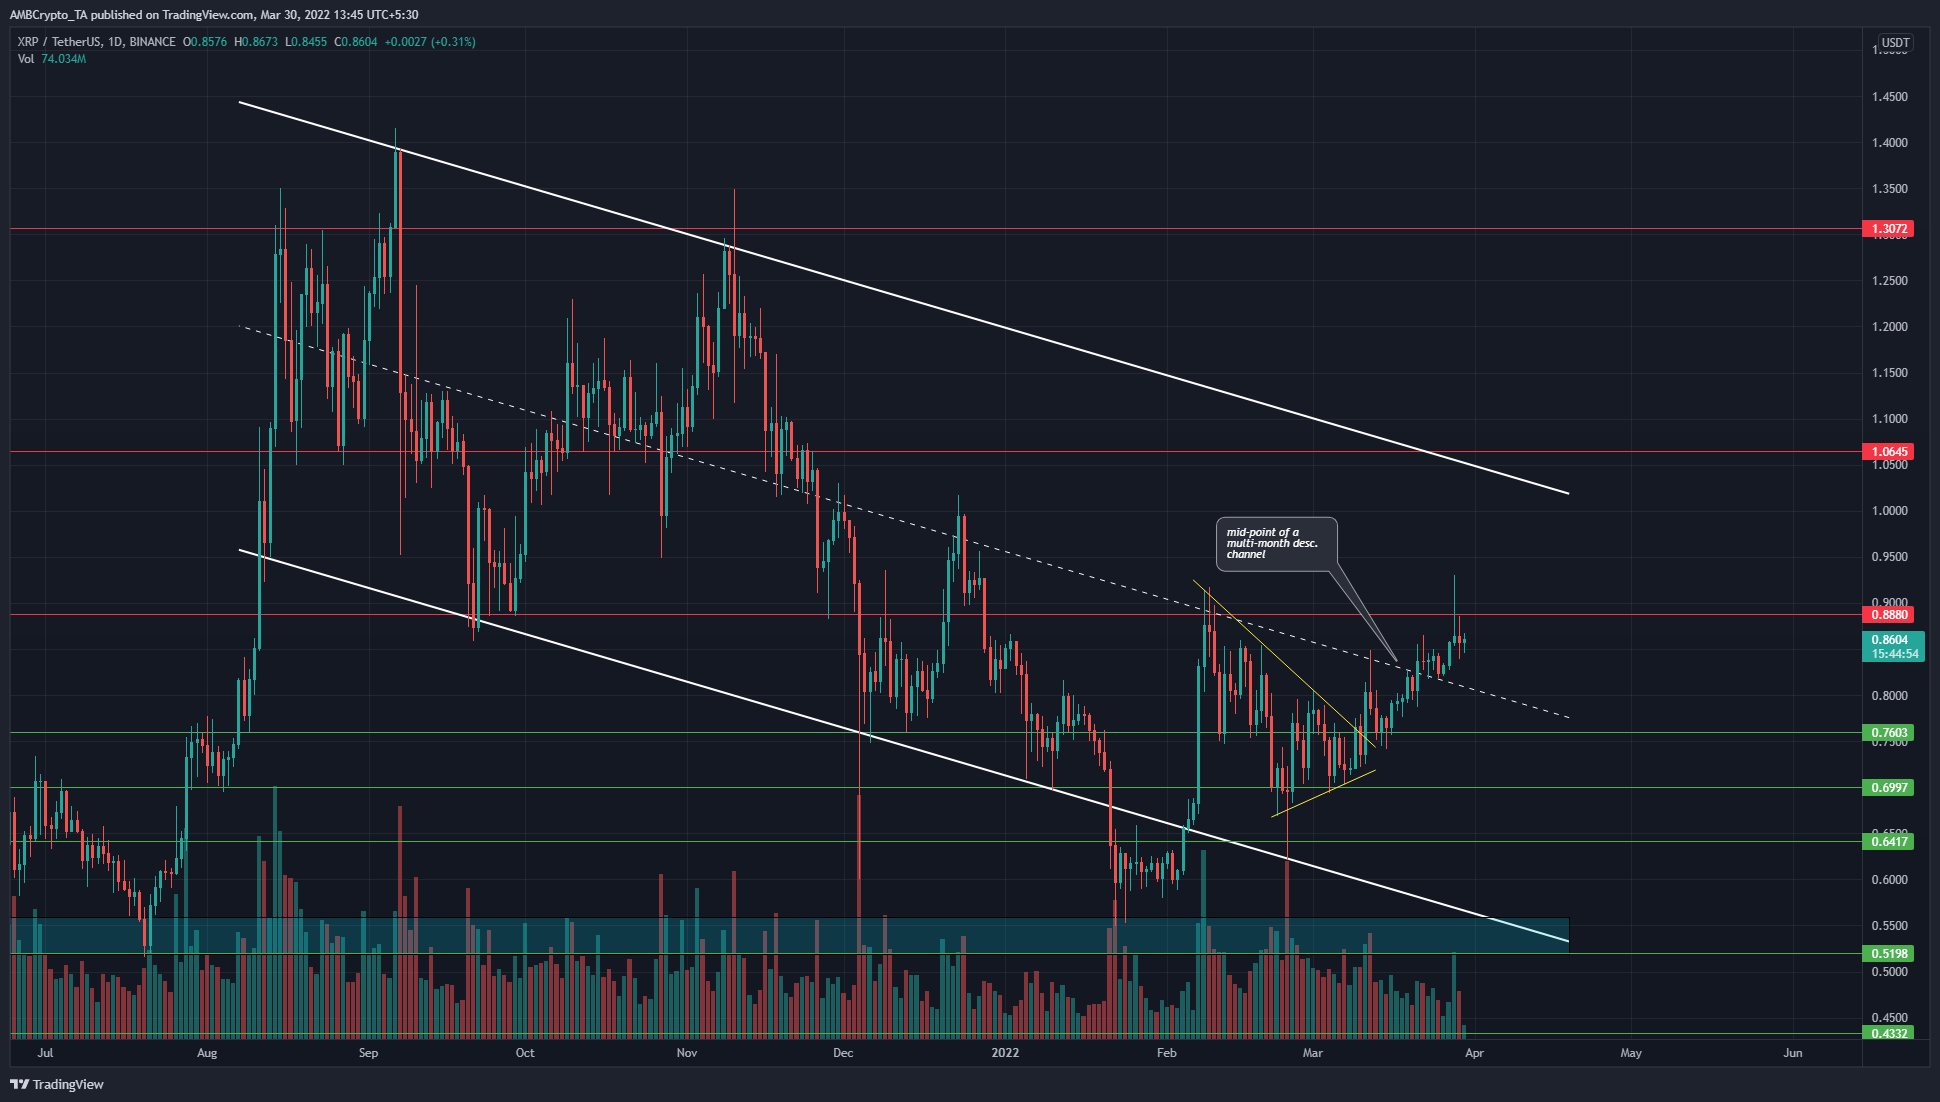
Since August, XRP has been trading within a descending channel (yellow). The mid-point of this channel has been respected as support and resistance in these months, which adds credence to the channel pattern plotted.
In February and March, the price formed a compression pattern of a symmetrical triangle (yellow). In the past couple of weeks, the price has broken out of this pattern and also climbed past the mid-point of this channel. Moreover, the recent swing highs since the early February rally have all been broken. This, alongside the formation of the higher lows, suggested that a bullish trend was in progress.
Rationale
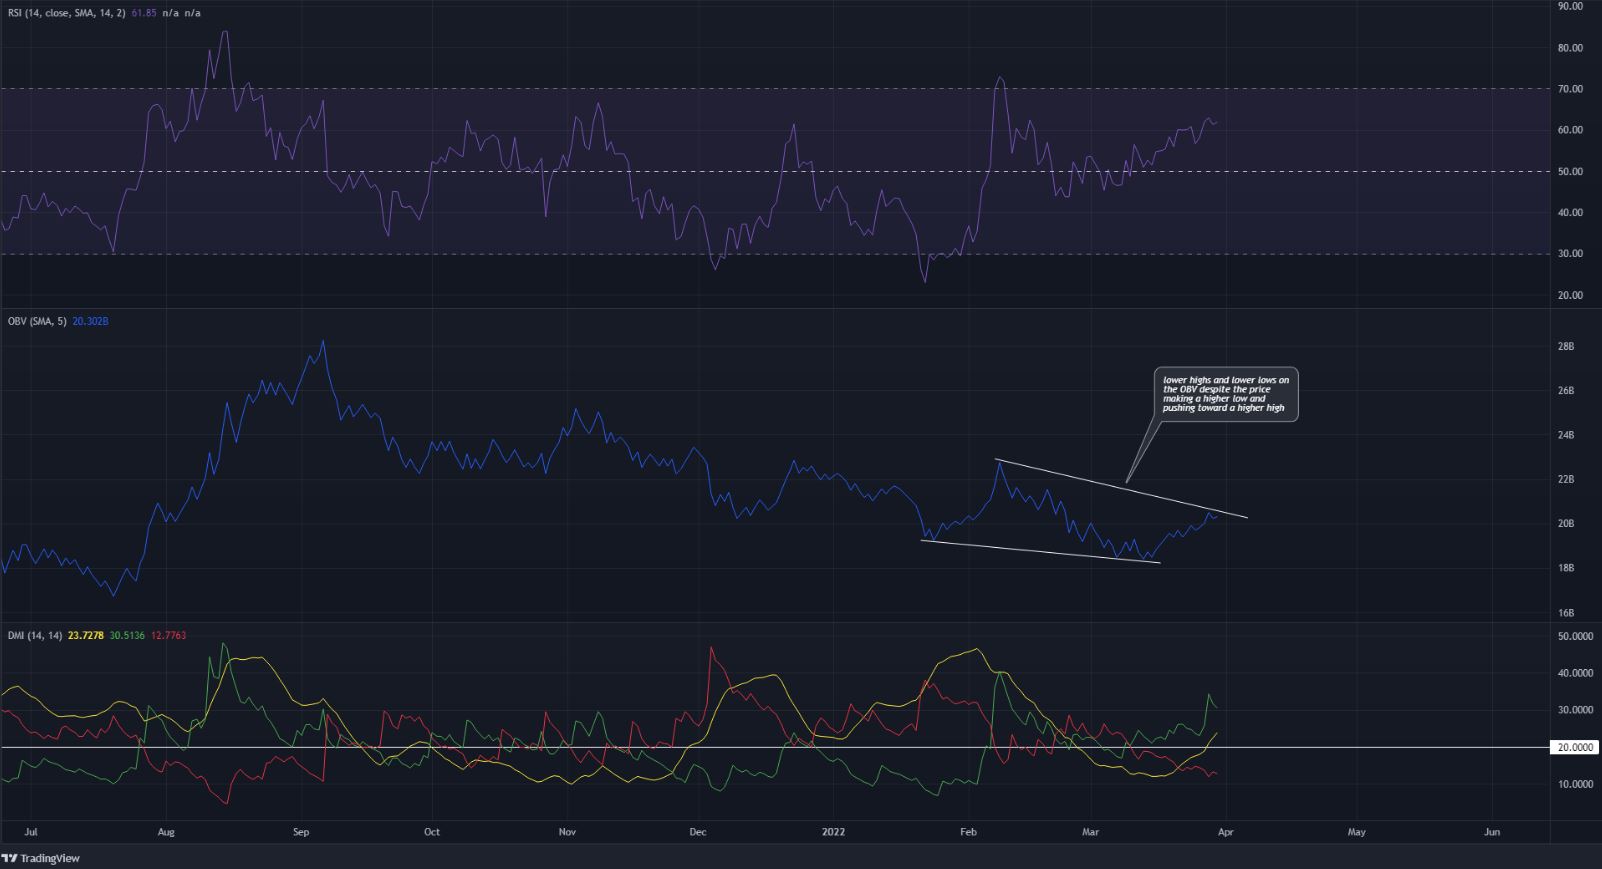
On the daily chart, the RSI was back above neutral 50 and climbing. A divergence was not evident yet. The DMI also showed a strong bullish trend in progress.
However, the OBV threw some curveballs. On the daily chart, even though the price and the momentum were bullish and rising since the $0.6 bottom in January, the OBV did not agree. It registered lower highs and lower lows following the early February rally, even as the price at press time made higher lows and broke the recent swing high.
Conclusion
The market structure and momentum were bullish behind XRP. Trading volume was steady but not enormous after the breakout from the triangle pattern. There was some evidence that showed a possible lack of demand behind XRP. Technically, the $1-$1.05 is likely to be the next major area of resistance for XRP over the next month.