XRP, Cosmos, Dash Price Analysis: 14 February

XRP lacked the momentum to break upwards from the $0.63 mark despite a bullish divergence. In fact, sellers could step in and take control of the XRP market moving forward. Similarly, ATOM and DASH could also concede to the sellers even after the former coin traded at record levels just yesterday.
XRP

Source: XRP/USD, TradingView
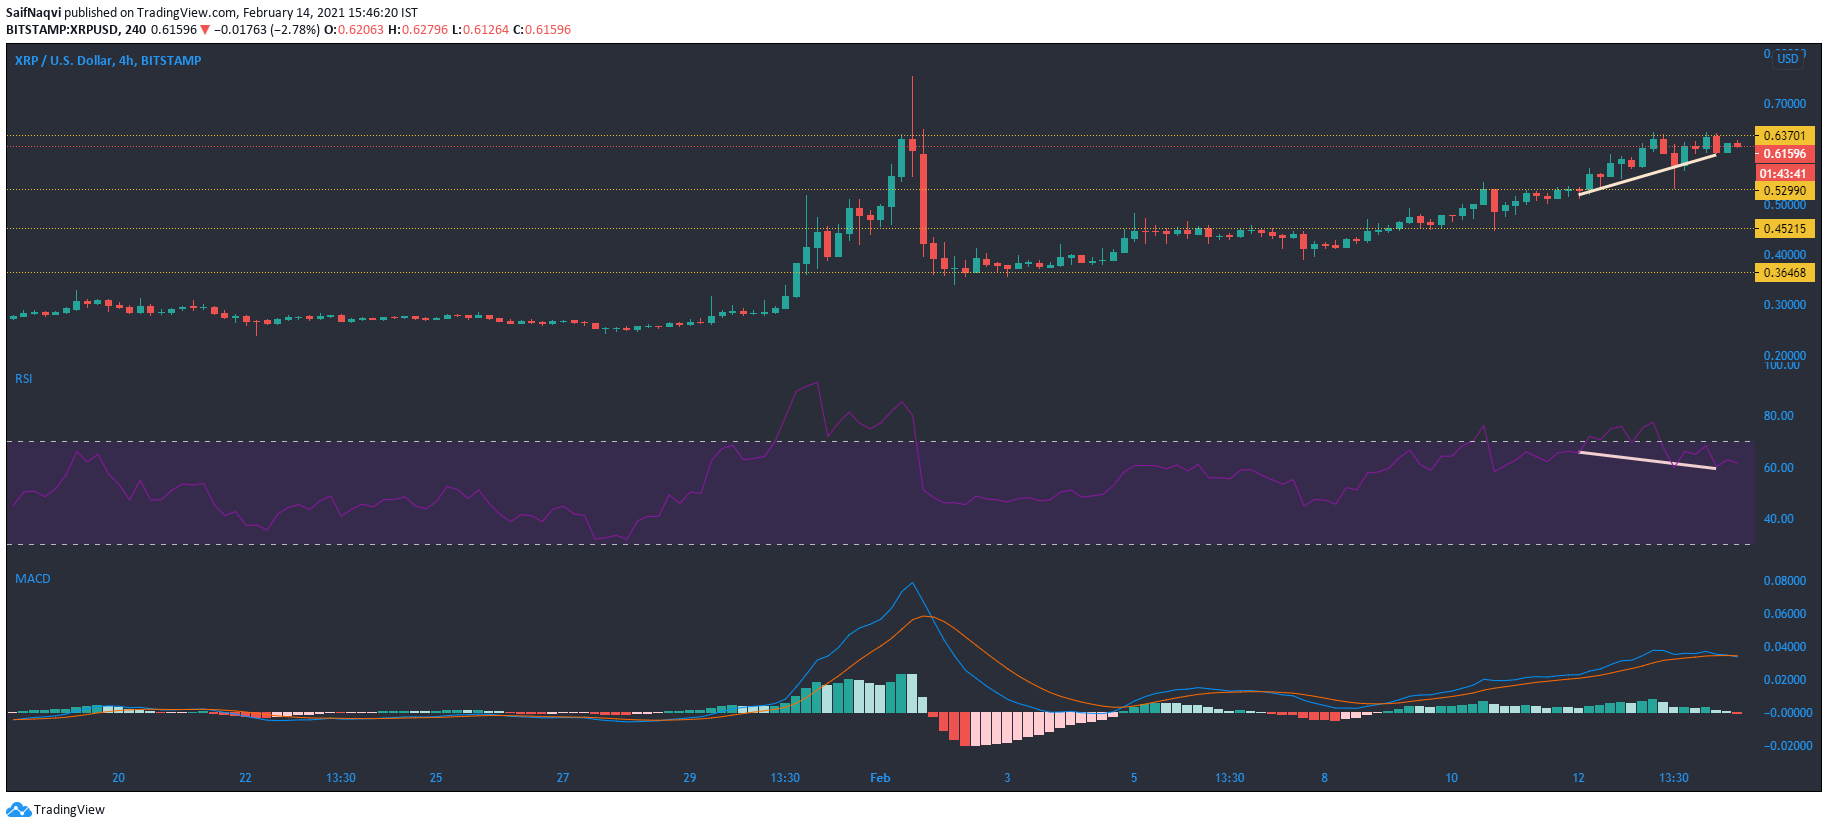
XRP’s northbound movement was halted at a strong resistance line of $0.63 even after a bullish divergence formed on the RSI. This suggested that stronger conviction was needed in the market to back an upwards breakout in the coming sessions. In fact, the MACD closed in on a bearish crossover and suggested that market control might switch to the selling side in the short term.
The bearish predictions could mark the onset of a downtrend especially if the bulls fail to hold on to $0.45 support. However, buyer numbers were still significant to counter any selling pressure in the coming sessions.
Cosmos [ATOM]

Source: ATOM/USD, TradingView
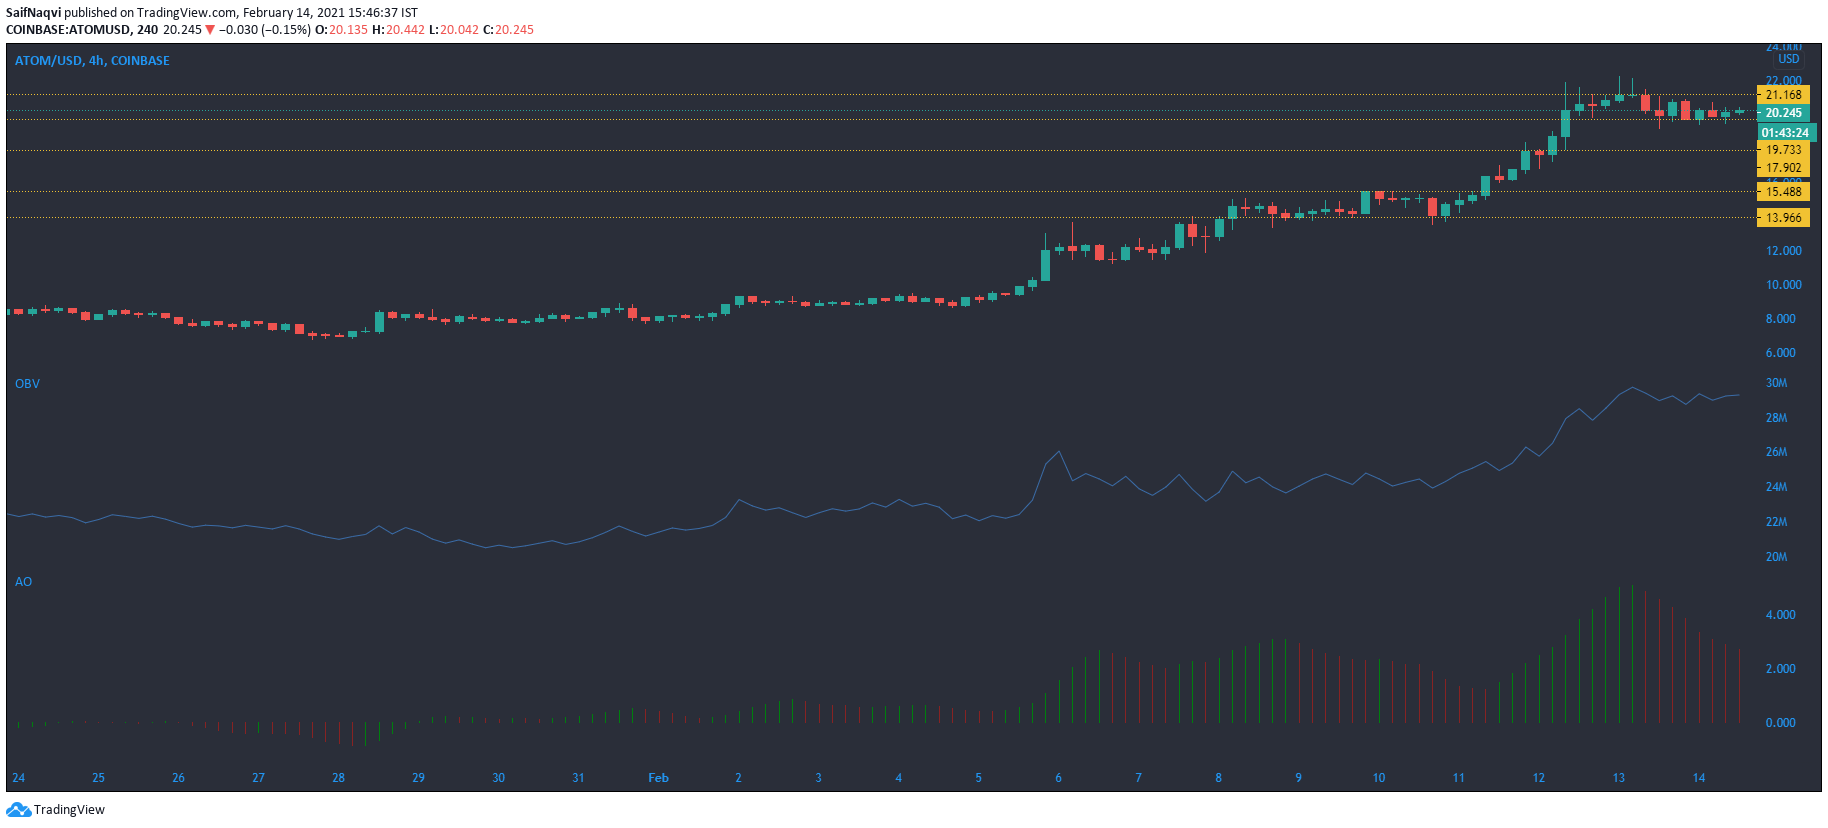
Cosmos moved in the red territory at the time of writing as the price dropped by nearly 4% in the last 24 hours. The Awesome Oscillator showed that bearish momentum was on the up and the bulls were in danger of losing out on the $19.7 support mark.
A favorable outcome could only be expected if the buying pressure spikes in the next few sessions and the same are captured by the OBV. A bullish scenario would see ATOM climb to a fresher all-time high on the charts. Conversely, a fall below the current support mark would present the next line of defense at $17.9.
Dash [DASH]

Source: DASH/USD, TradingView
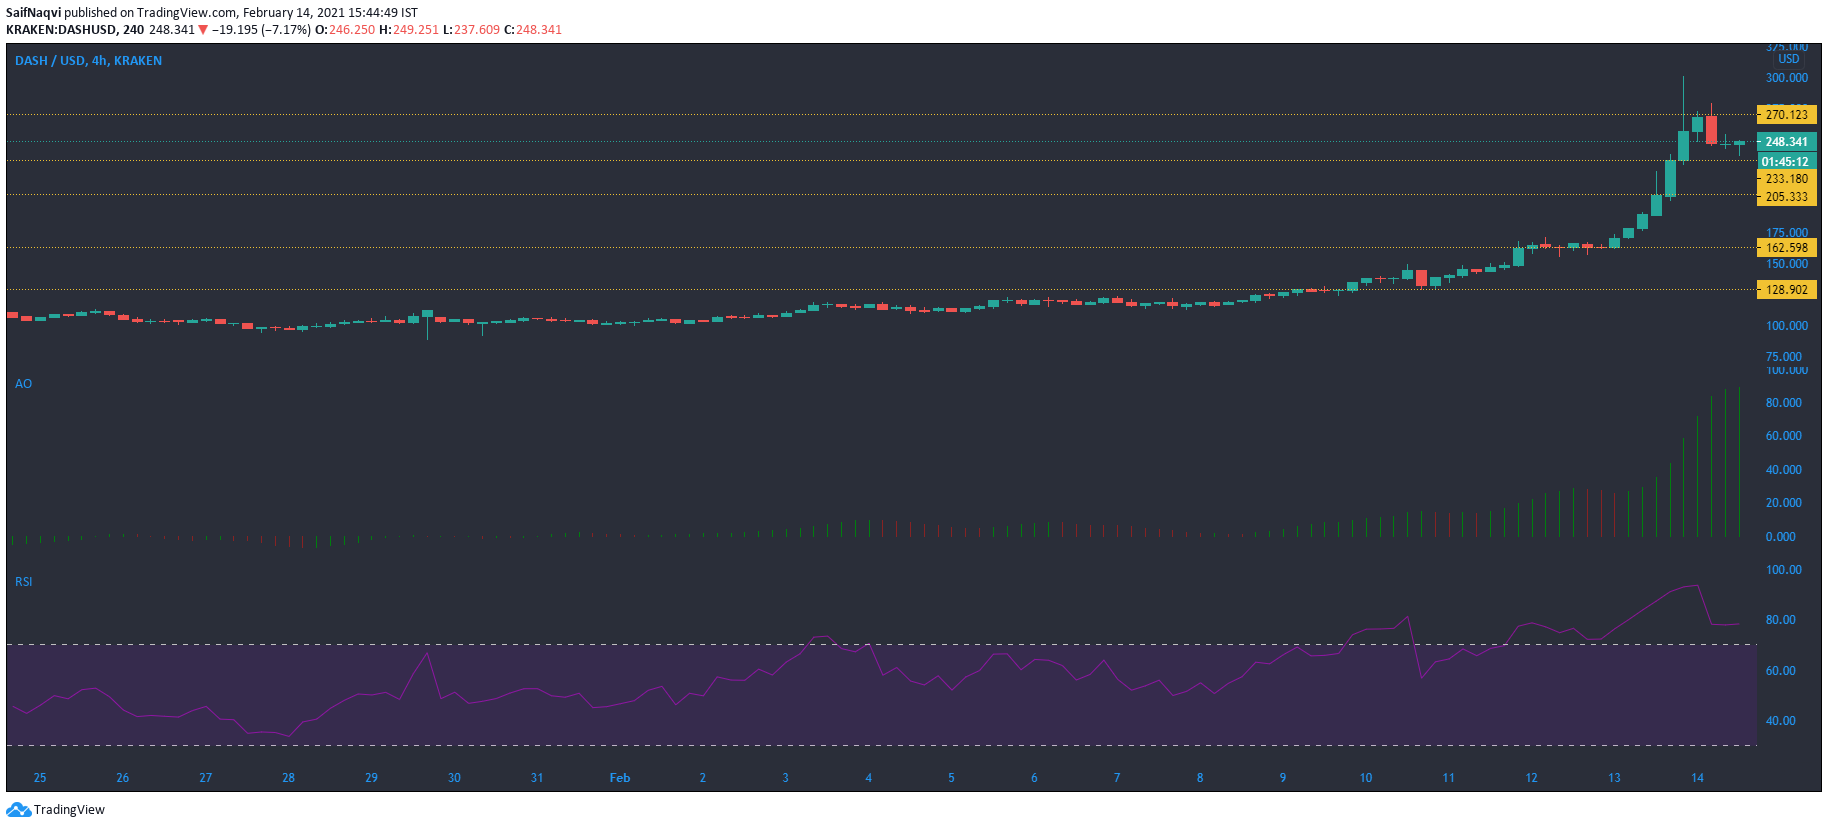
Dash surged by over 20% since yesterday and climbed to a local high of $279, a level that was last seen in July 2018. The recent interest in the privacy-coin was registered on the 24-hour trading volumes, which skyrocketed by over 200% and clocked in at over $7 billion. The Awesome Oscillator highlighted the strong bullish momentum. On the downside, the formation of a red candlestick on its 4-hour chart gave rise to the possibility of a correction.
The same was further accentuated by the RSI which hinted at a reversal. In the event of a pullback, support levels reside at $233.2 and $205.3.


