XRP defends $0.46 yet again, but here’s the ‘but’ of it all

Disclaimer: The information presented does not constitute financial, investment, trading, or other types of advice and is solely the writer’s opinion.
- The market structure of XRP was technically bearish as buyers continued to show weakness on the daily chart.
- The lack of accumulation in recent weeks showed that further losses were possible.
XRP was trading in a zone of support from late April. It was clear that buyers have been desperate to defend the $0.45-$0.47 support zone over the past month. Yet, the bulls have wearied. Evidence for this was the weaker and weaker reaction XRP saw from the support zone.
Read XRP’s Price Prediction 2023-24
Apart from the bearish leaning price action, the on-chain metrics also showed that buyers lacked conviction. Network-wide accumulation was absent. Hence, XRP could be slow to react positively if Bitcoin [BTC] saw a surge higher.
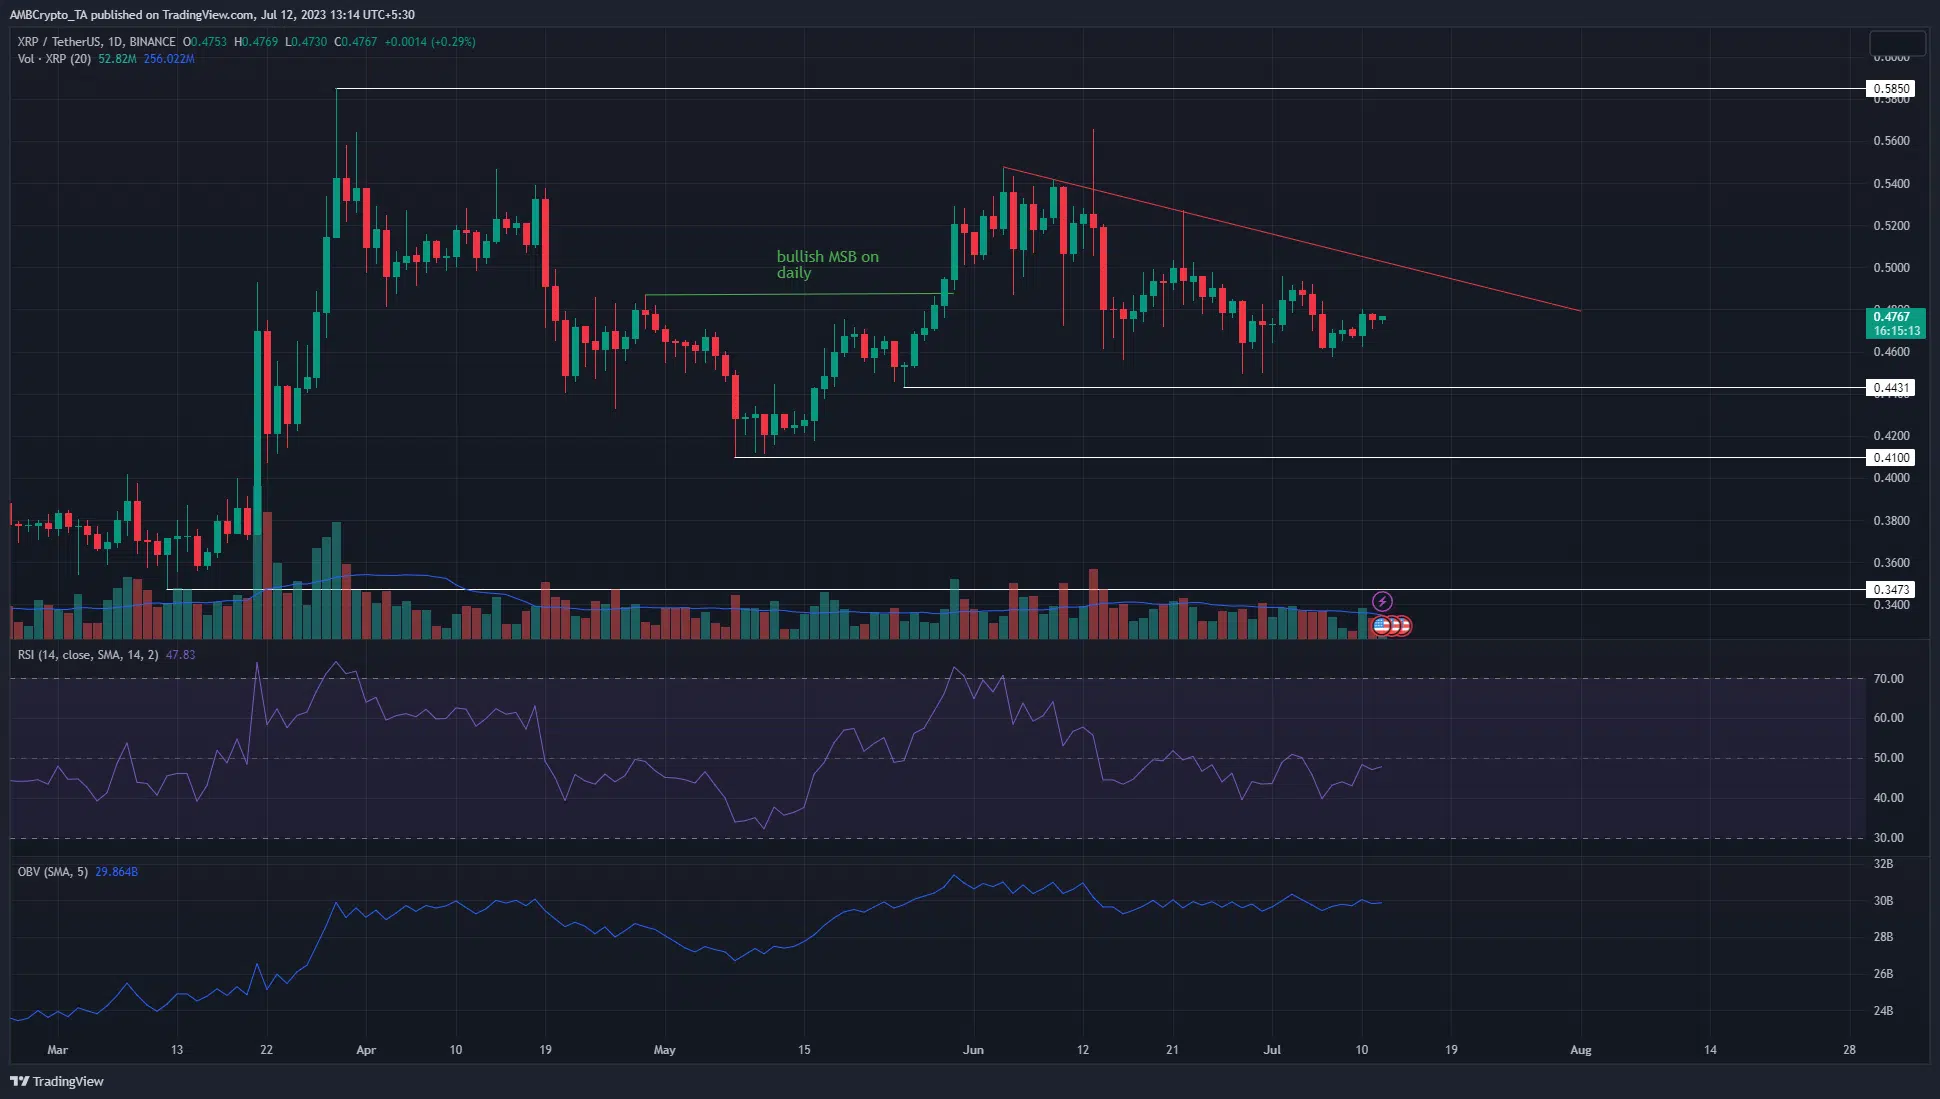
XRP bulls continue to defend the $0.46 level but are getting pushed further south
The 1-day price chart of XRP showed that the market structure was bullish in early June. Thereafter, buyers were unable to keep pace with the repeated waves of selling in the $0.5-$0.52 zone that commenced from 5 June. This saw XRP drop to $0.456 on 16 June, technically a higher low.
Two weeks later XRP dipped to the $0.449 mark on 28 June, while also forming a lower high with a candlewick to the $0.527 mark. This flipped the structure bearish, highlighting the dominance of sellers in recent weeks. The OBV has also been in a slow downtrend since early June. The RSI has been moving below the neutral 50 line since mid-June, showing bearish momentum as well.
The $0.45-$0.47 zone has been significant since April and was likely to serve as support again. Each bounce from this level formed a lower high, underlining weakness from the buyers. This could see the price drop to $0.41 if the $0.45 support was breached.
How much are 1, 10, 100 XRP worth today?
XRP metrics showed it was undervalued but bulls were not yet ready

Source: Santiment
Santiment data showed that the 90-day MVRV ratio was negative. This showed the asset was slightly undervalued, but it was not enough to convince buyers to accumulate XRP. Instead, the 90-day mean coin age has been in a downtrend since late May.
This was a sign of sustained selling and pointed toward a downtrend for XRP in the coming weeks. The dormant circulation has been quiet over the past ten days, but traders can keep an eye on the metric as a large spike would point toward increased selling activity.


