Volatility was shrinking in the XRP market and some rangebound movement was predicted moving forward. Buying resumed for Dogecoin as the price overturned $0.69 from resistance to support. Lastly, Cardano presented a few targets above $2 which could be toppled in the coming weeks.
XRP
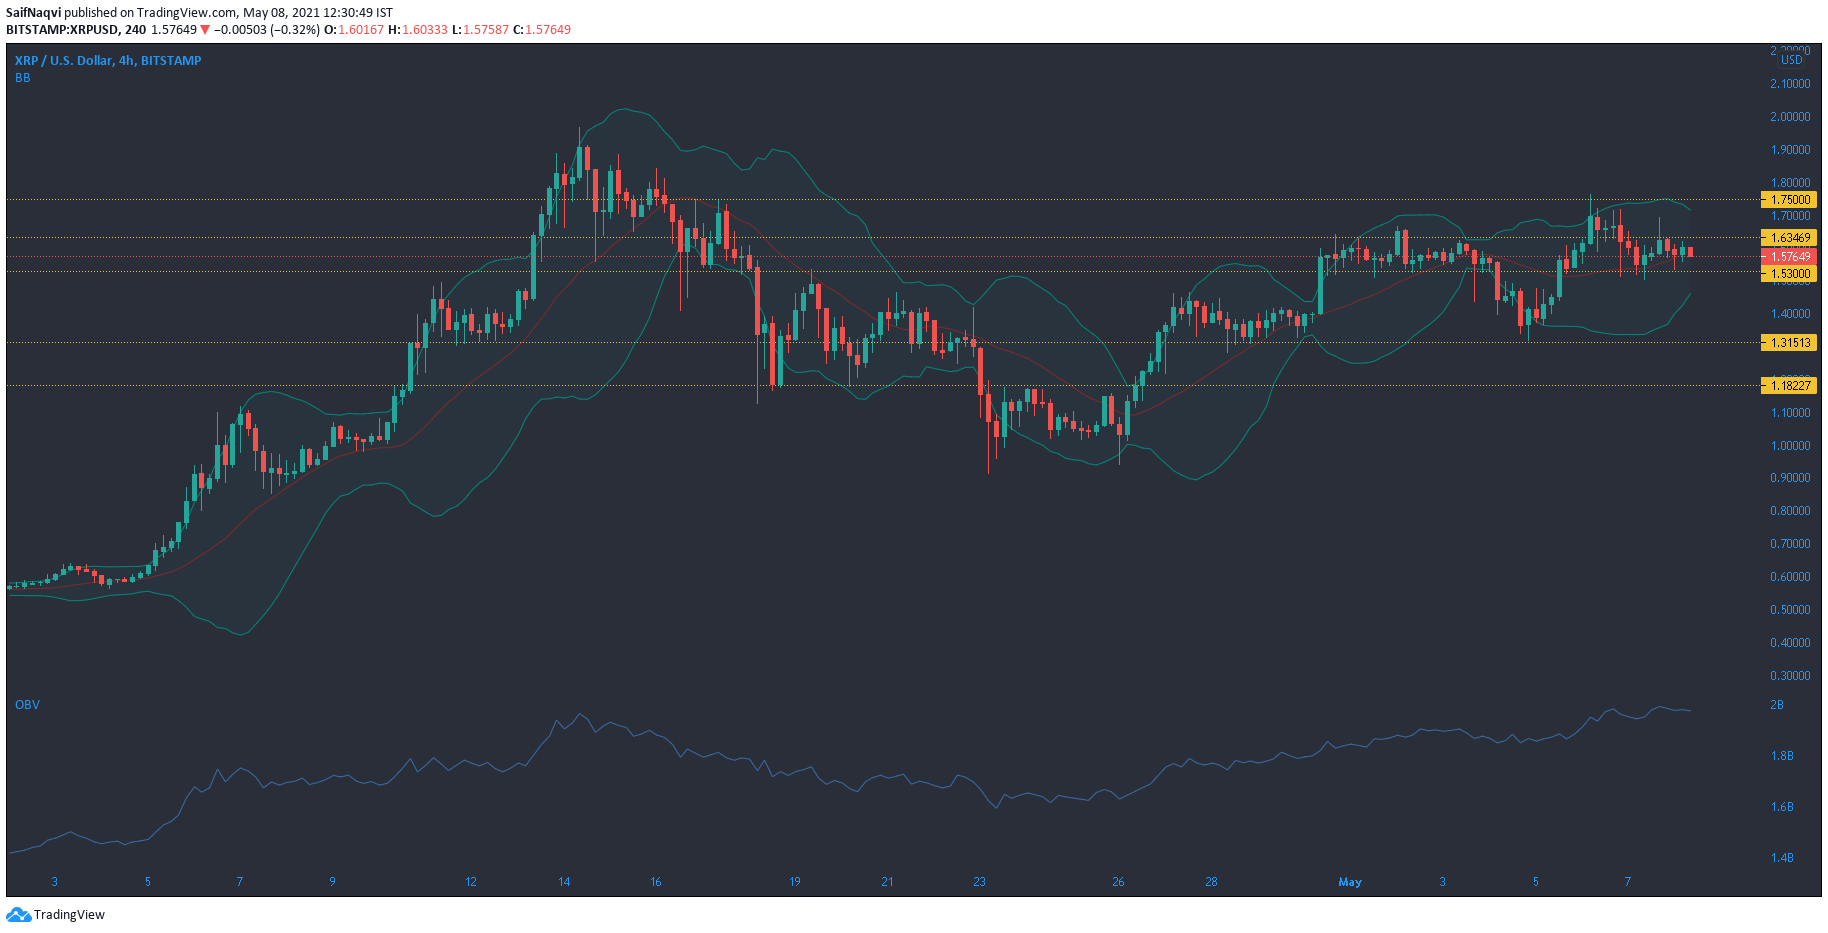
Source: XRP/USD, TradingView
At the time of writing, the world’s fifth-largest cryptocurrency – XRP was trading within a range of $1.63-$1.53. Bollinger Bands contracted and a volatile market that saw XRP rise from $1.31 to $1.75 was now coming to an end. This suggested some short-term sideways movement. On the other hand, OBV has been on an uptrend since late April and buying pressure has been steadily building up in the market.
If the $1.75-ceiling is toppled, XRP could shoot north of $1.96 and register a new local high. If the market takes a bearish path, $1.31-support could be under the spotlight.
Dogecoin [DOGE]
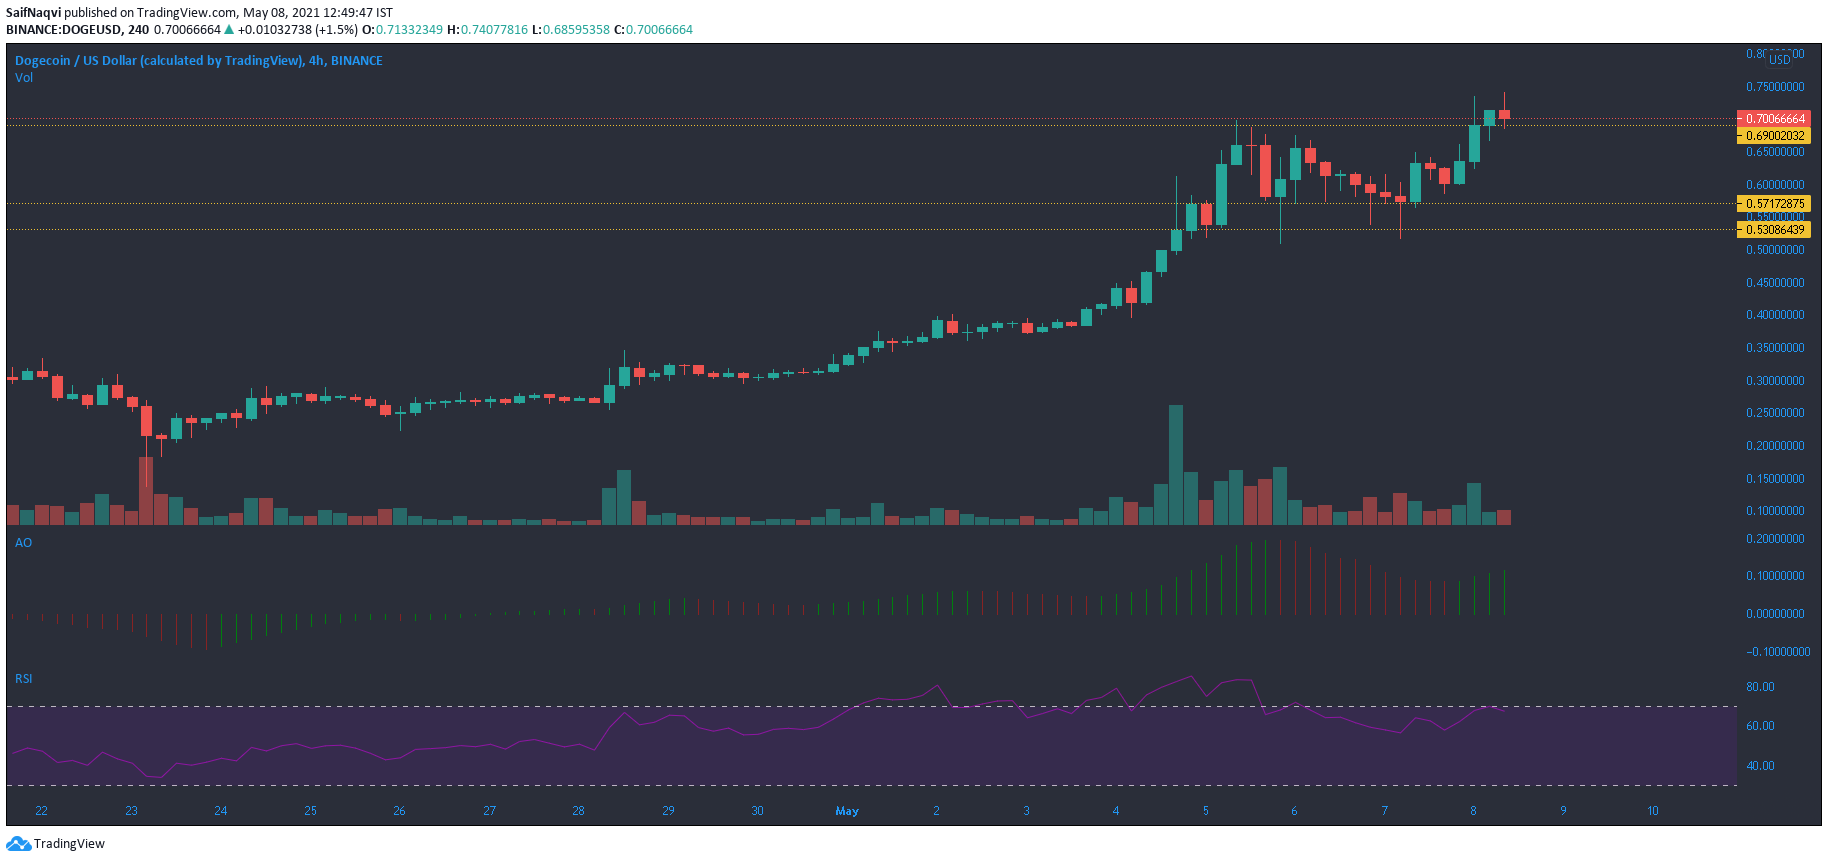
Source: DOGE/USD, TradingView
Dogecoin jumped by 8% in the last 24-hours as the buying frenzy resumed after yesterday’s cooldown. According to the Awesome Oscillator, momentum was with the bulls and the bars switched to green once again. This was widely anticipated as Elon Musk’s Saturday Night Live appearance was now just a few hours away. RSI was also in bullish territory above 65. Even if the index moved in the overbought zone, it would be of little consequence as bullish sentiment alone could drive DOGE.
On the 4-hour timeframe, buyers flipped $0.69-resistance to a region of support. While volumes were yet to reach levels seen a few days ago, this could quickly change in the coming sessions. A bullish outcome could see DOGE rise above $0.80 before a pullback. Once a sell-off occurs, support lines to watch out for include $0.57 and $0.53.
Cardano [ADA]
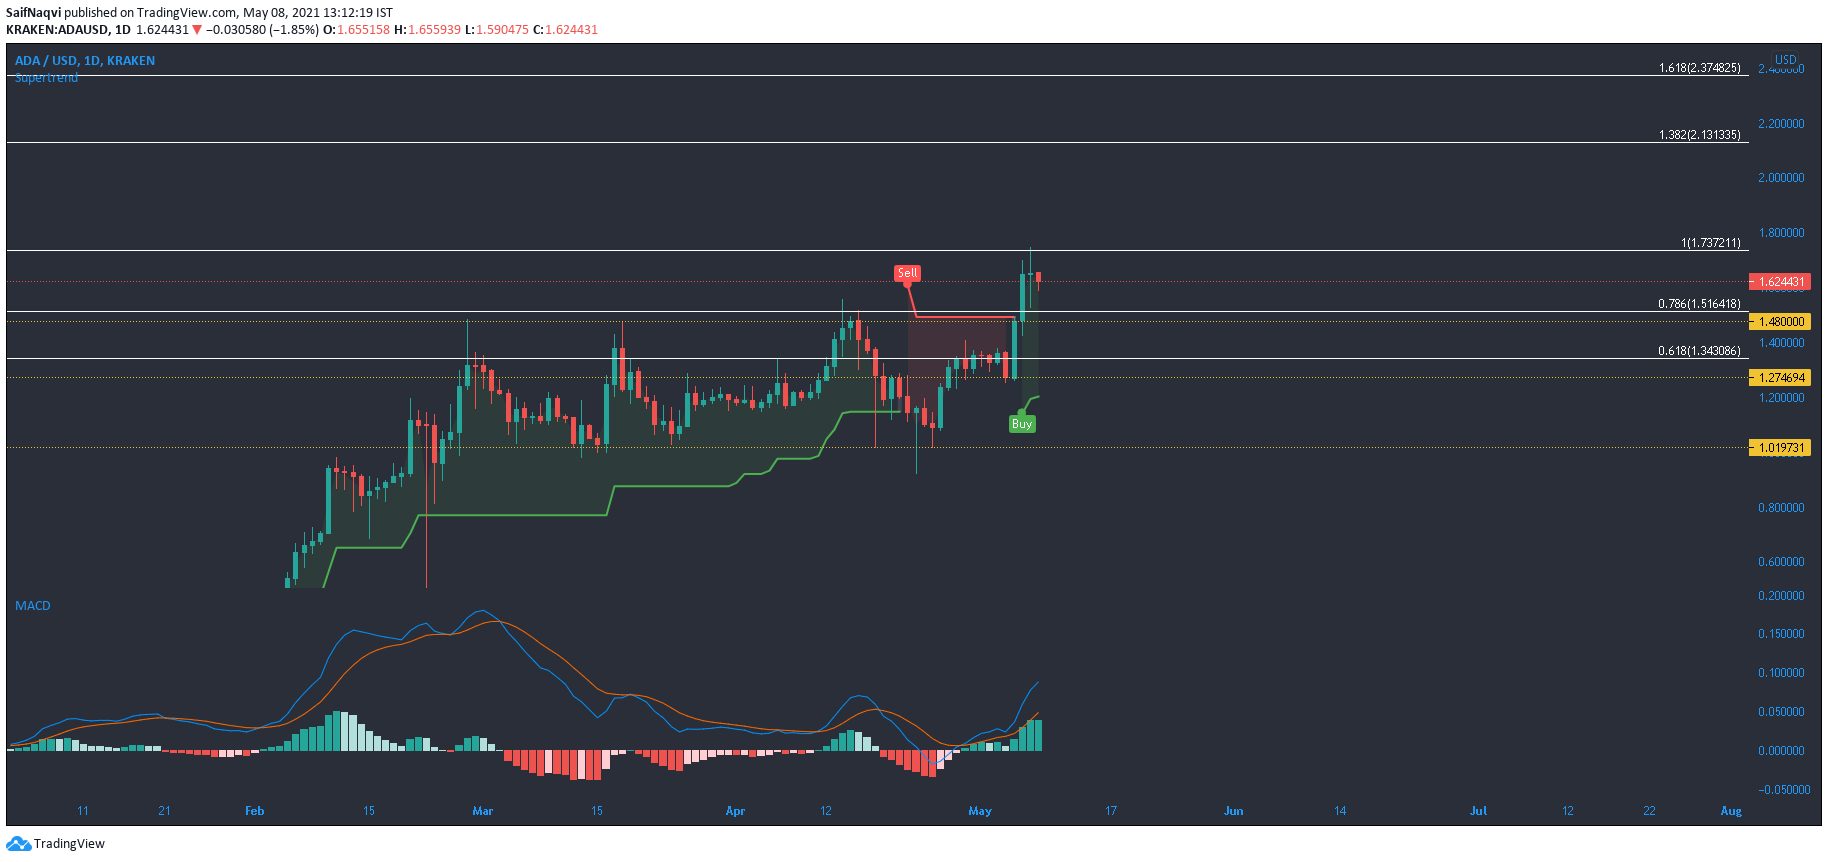
Source: ADA/USD, TradingView
Since early March, Cardano largely oscillated between the channel $1.48-$1.01. While a breakout did occur a couple of days ago, volumes were distant from levels seen during February. The technicals still highlighted a bullish market and a few Fibonacci levels were plotted on the daily timeframe.
MACD line maintained above the Signal line and its histogram noted a series of green bars. Supertrend Indicator continued to flash a buy signal which would switch to sell at $1.20. A few targets lay at 138.2% ($2.13) and 161.8% ($2.37) Fibonacci levels and these could be toppled in the coming weeks. Meanwhile, volumes must be observed for sharp price movement within the market.