
XRP presented the possibility of a descending triangle breakdown, one that could go as low as $1.31. Dogecoin surprised the market amid a continued sell-off even after Elon Musk’s SNL appearance. Ethereum warded off multiple sell signals and headed towards the $4k-mark.
XRP
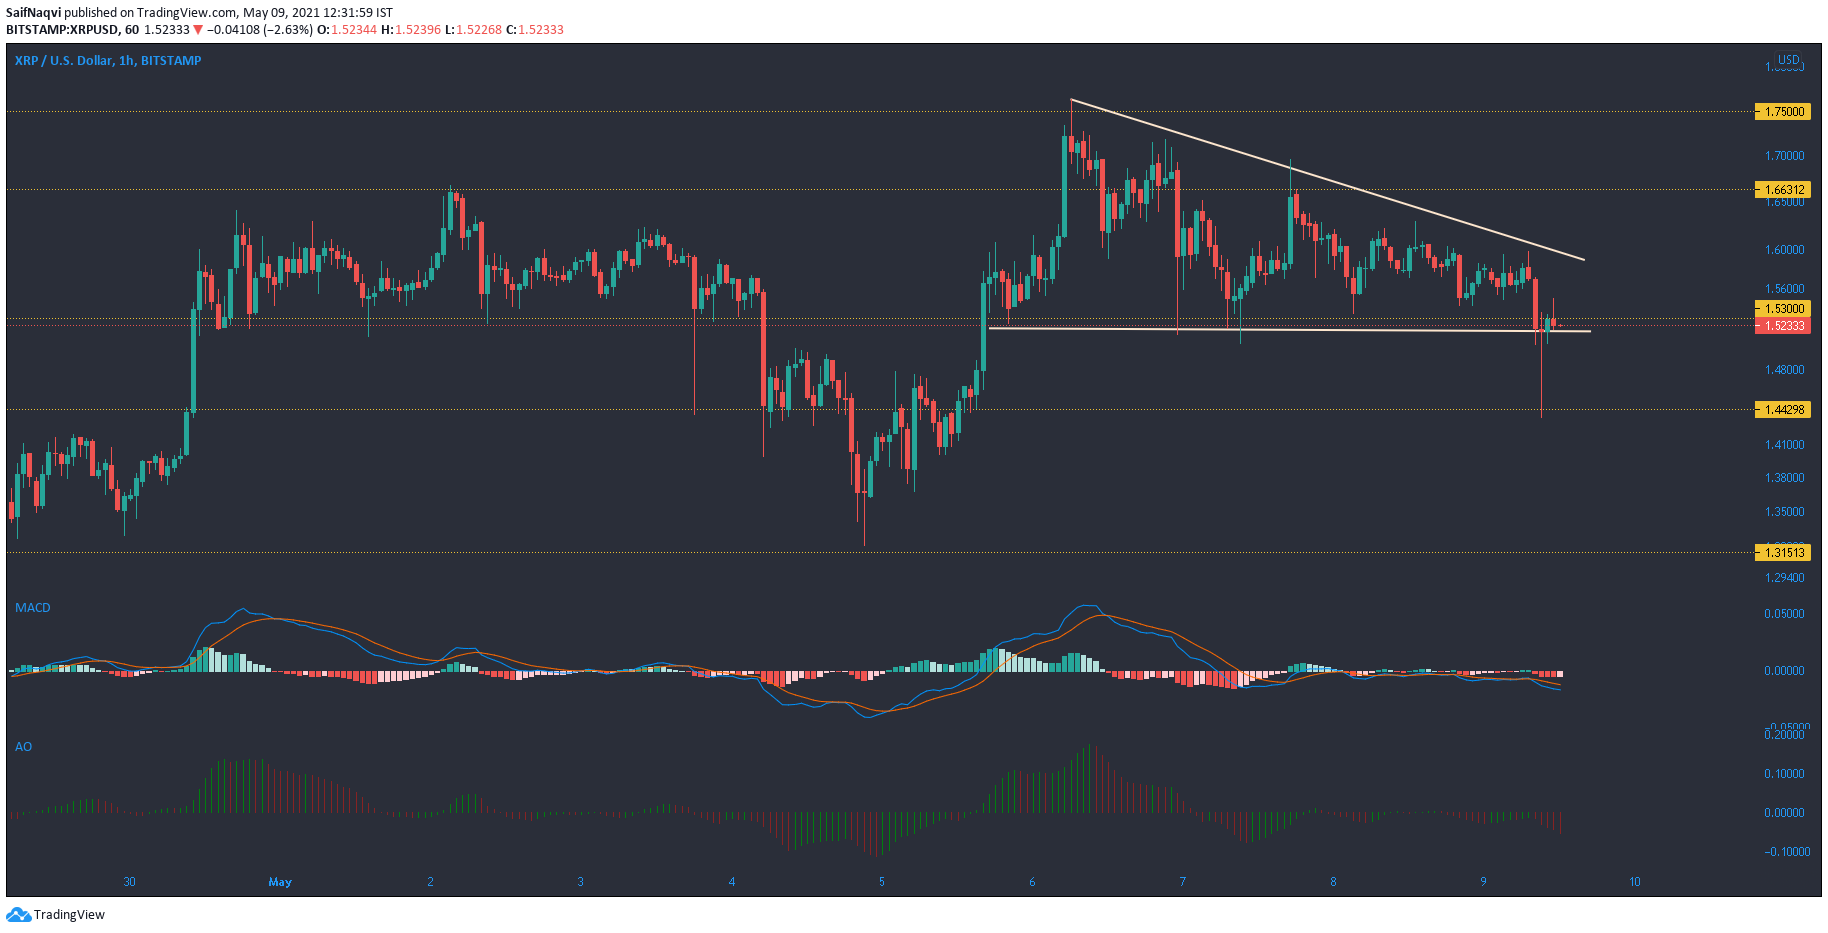
Source: XRP/USD, TradingView
On the hourly timeframe, a few candlewicks on XRP fell below $1.53 and it looked like this support had been breached. More bearish signals were highlighted as the candlesticks traded below all three moving averages (20-SMA, 50-SMA, 200-SMA- not shown). The charts also showed a descending triangle and if the bottom trendline is not defended from bearish pressure, a sell-off could take place.
This would likely see XRP drop to its first strong area of support at $1.44, but another dip could take it all the way towards $1.31. MACD has stayed below the half-line over the last couple of days as the price has struggled to rise above $1.66. If it does indeed break this ceiling, the pattern would be negated. Similar to the MACD, even Awesome Oscillator remained below equilibrium as momentum rested with the sellers.
Dogecoin [DOGE]

Source: DOGE/USD, TradingView
A sell-off on Dogecoin took place prior to Elon Musk’s SNL appearance and while some hoped for a positive impact and higher prices after the conclusion of the show, that was not the case. Instead, DOGE continued its descent and its price was now down by 25% in the last 24 hours. The 4-hour charts saw a single candlewick move below $0.58-support. If this is overturned in the coming hours, another support area lay at $0.42 but a more established line of defense lay at $0.275.
Awesome Oscillator formed a bearish twin peak setup and threatened to fall below equilibrium -a sign of the prevalent selling pressure in the market. A bearish divergence was also spotted on RSI as it headed below 40.
Ethereum [ETH]

Source: ETH/USD, TradingView
Several bearish signals were countered by bulls as they pushed Ethereum towards the $4,000- mark at the time of writing. The 4-hour charts showed a breakout from the upper trendline of an ascending channel as bullish cues returned in the market. The Squeeze Momentum Indicator, which previously showed declining bullish momentum, now registered a series of rising green bars once again. The white dots suggested a ‘squeeze release’ and higher volatility could push ETH further before a pullback.
While the RSI did move in an area of reversal, it has remained above 55 during the past two weeks and a sharp correction seemed unlikely. If this does take place, support levels reside at $3,600 and $3,377.