
XRP rose above the upper trendline of its symmetrical triangle and its technicals backed an extended rally. Dogecoin eyed another 30% rise towards $0.445-resistance. Finally, MATIC targeted a jump towards $1.95 but buying pressure was yet to fully materialize.
XRP

Source: XRP/USD, TradingView
While XRP did break north from its symmetrical triangle and registered gains of 9% from the upper trendline, targets mentioned in a previous analysis were yet to be realized. A bullish twin peak setup on Awesome Oscillator suggested that buying pressure would increase over the coming sessions. Even MACD line maintained above the Signal line and provided bullish indication.
On the downside, a retest of $1.03-support could result in some sideways movement. A dip back towards $0.91 was also possible in case of bearish cues from the broader market.
Dogecoin [DOGE]
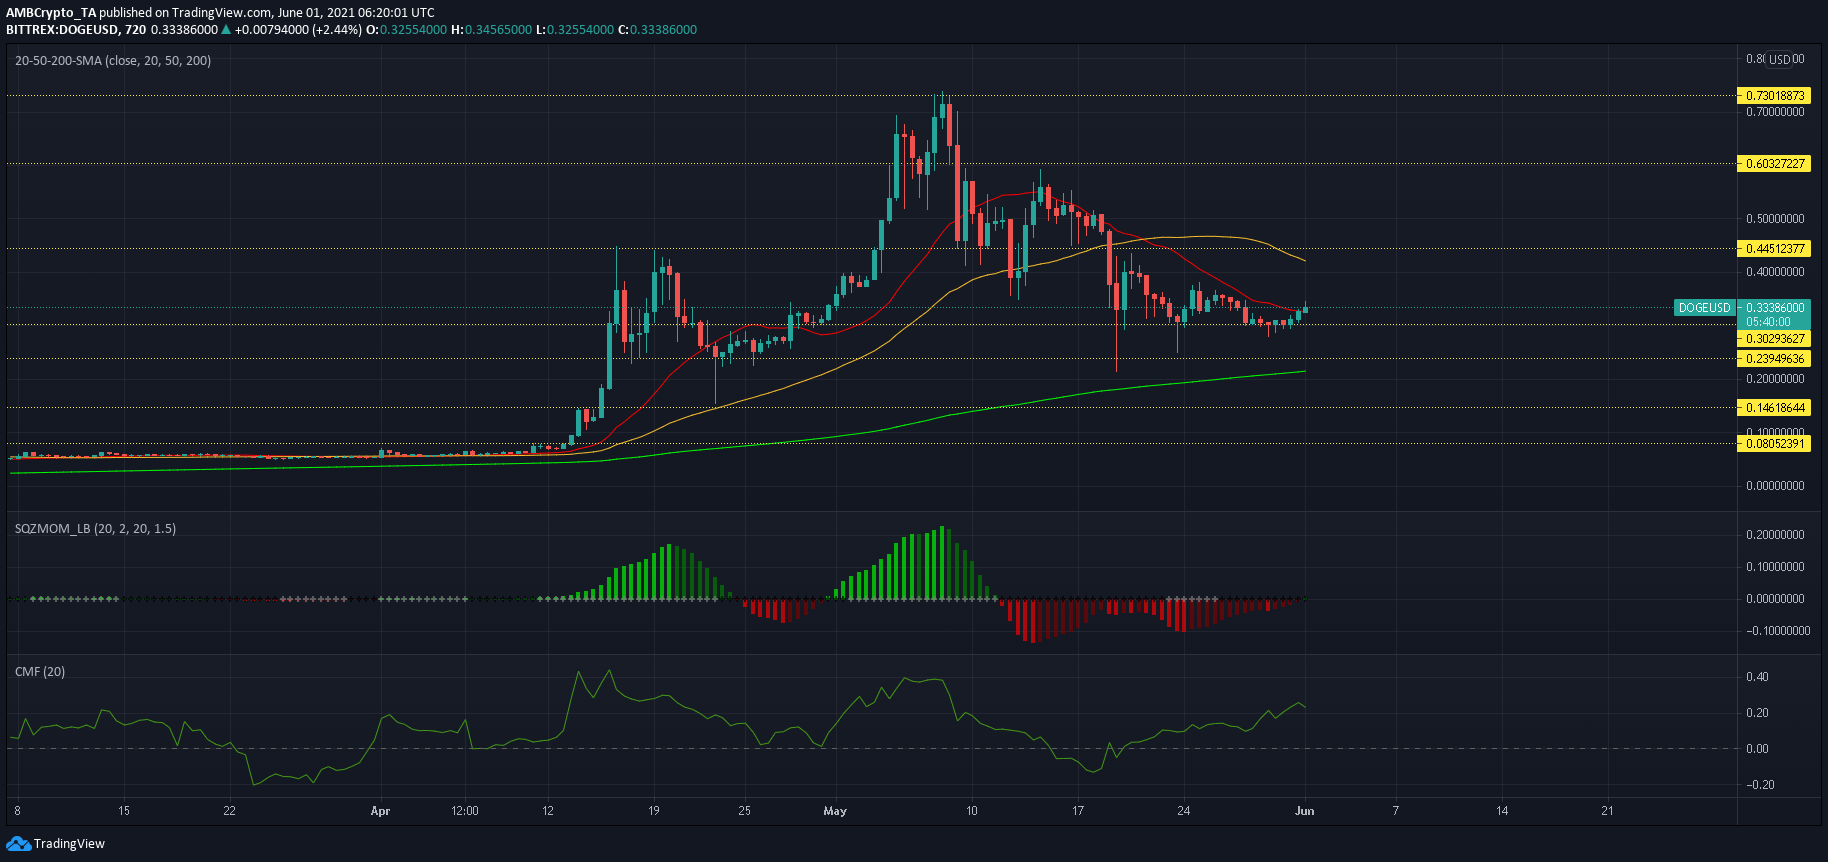
Source: DOGE/USD, TradingView
Dogecoin defended a crucial support mark at $0.302 as its price jumped by 13% over the last 24 hours. Squeeze Momentum Indicator showed that there was bullish momentum behind DOGE’s rise but a strong resistance mark lay at $0.445- a line that also clashed with 50-SMA (yellow). However, a buy signal would be presented once a green bar is followed by white dots on the SMI. In case of a breakout, the next target lay at $0.603-resistance.
If a breakout is denied, expect DOGE to maintain its current channel over the coming days. Capital inflows remained healthy according to Chaikin Money Flow and this could deny further breakdown attempts by sellers.
MATIC
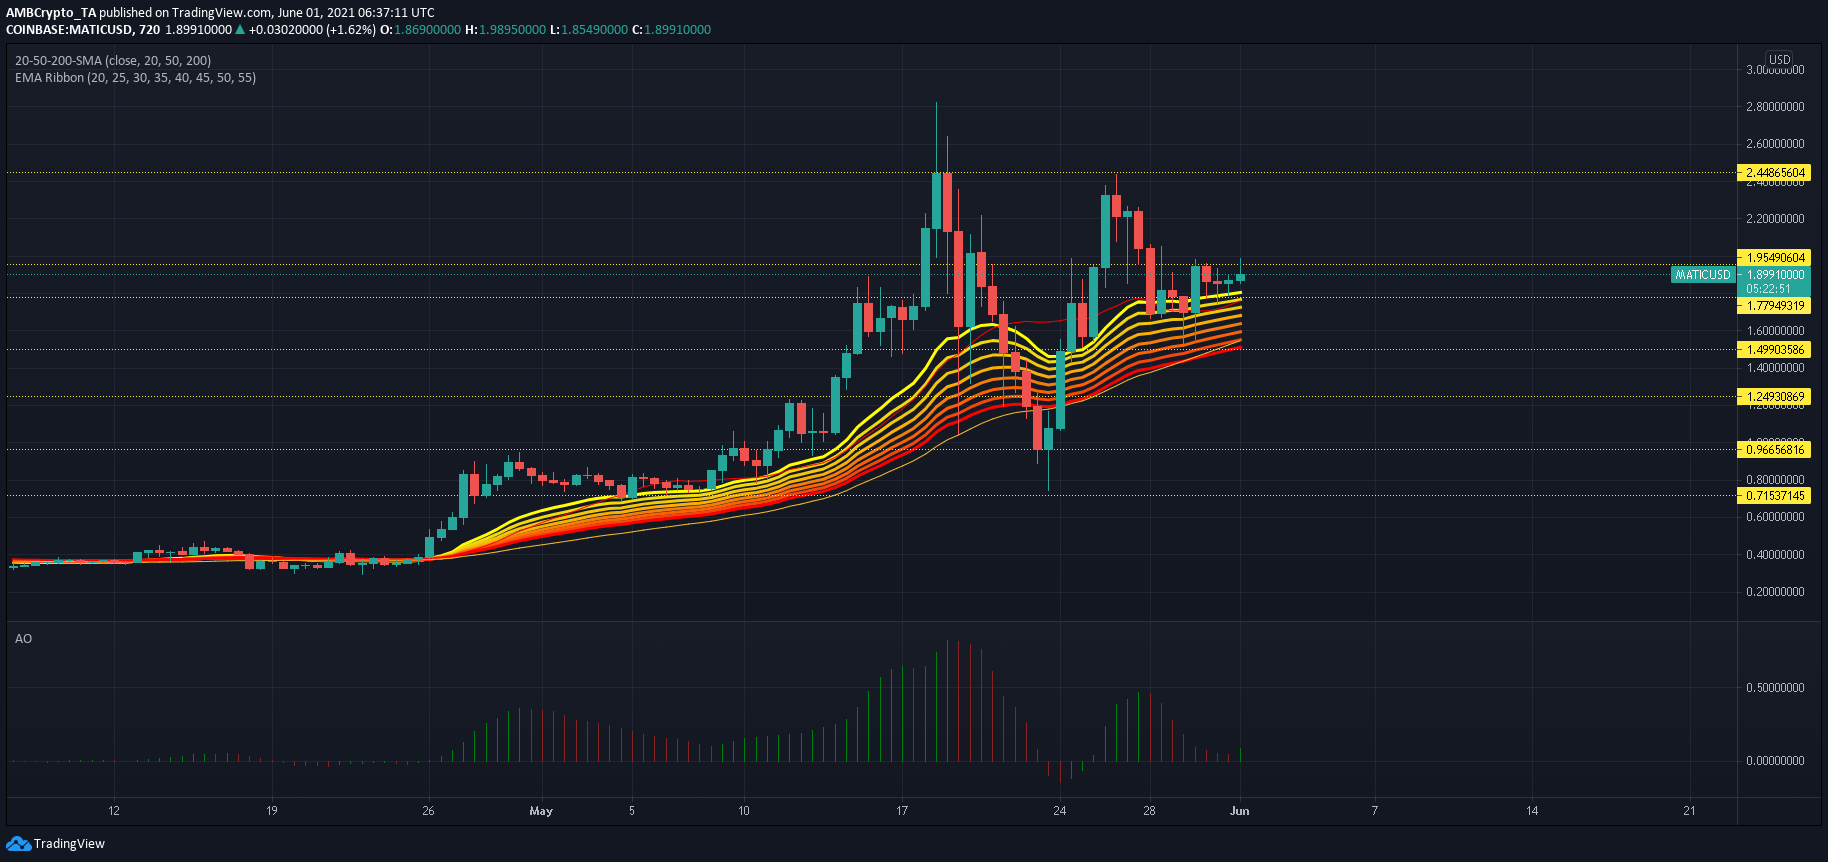
Source: MATIC/USD, TradingView
Although most alts were registering bullish movement of their own at press time, MATIC was slow to catch up to the rest of the market. At press time, MATIC posted minor gains of 4% over the last 24 hours. Its movement on the 12-hour timeframe was restricted between $1.95 but supported at $1.77 by the 20-SMA (red). A breakout on strong volumes could see MATIC trend higher towards the next ceiling at $2.44.
However, bullish momentum was yet to accumulate for such a swing according to Awesome Oscillator. A series of green bars would denote rising buying pressure. If MATIC ceded $1.77 to the sellers, losses could amplify all the way towards $1.49 or even $1.24 Since the EMA Ribbons added an extra layer of defense between $1.49-$1.21, an extended sell-off was unlikely.