XRP, EOS, Avalanche Price Analysis: 20 October

While the king-coin rallied towards its ATH, altcoins like XRP, EOS, and AVAX consolidated. However they followed reasonably bullish price trajectories.
XRP
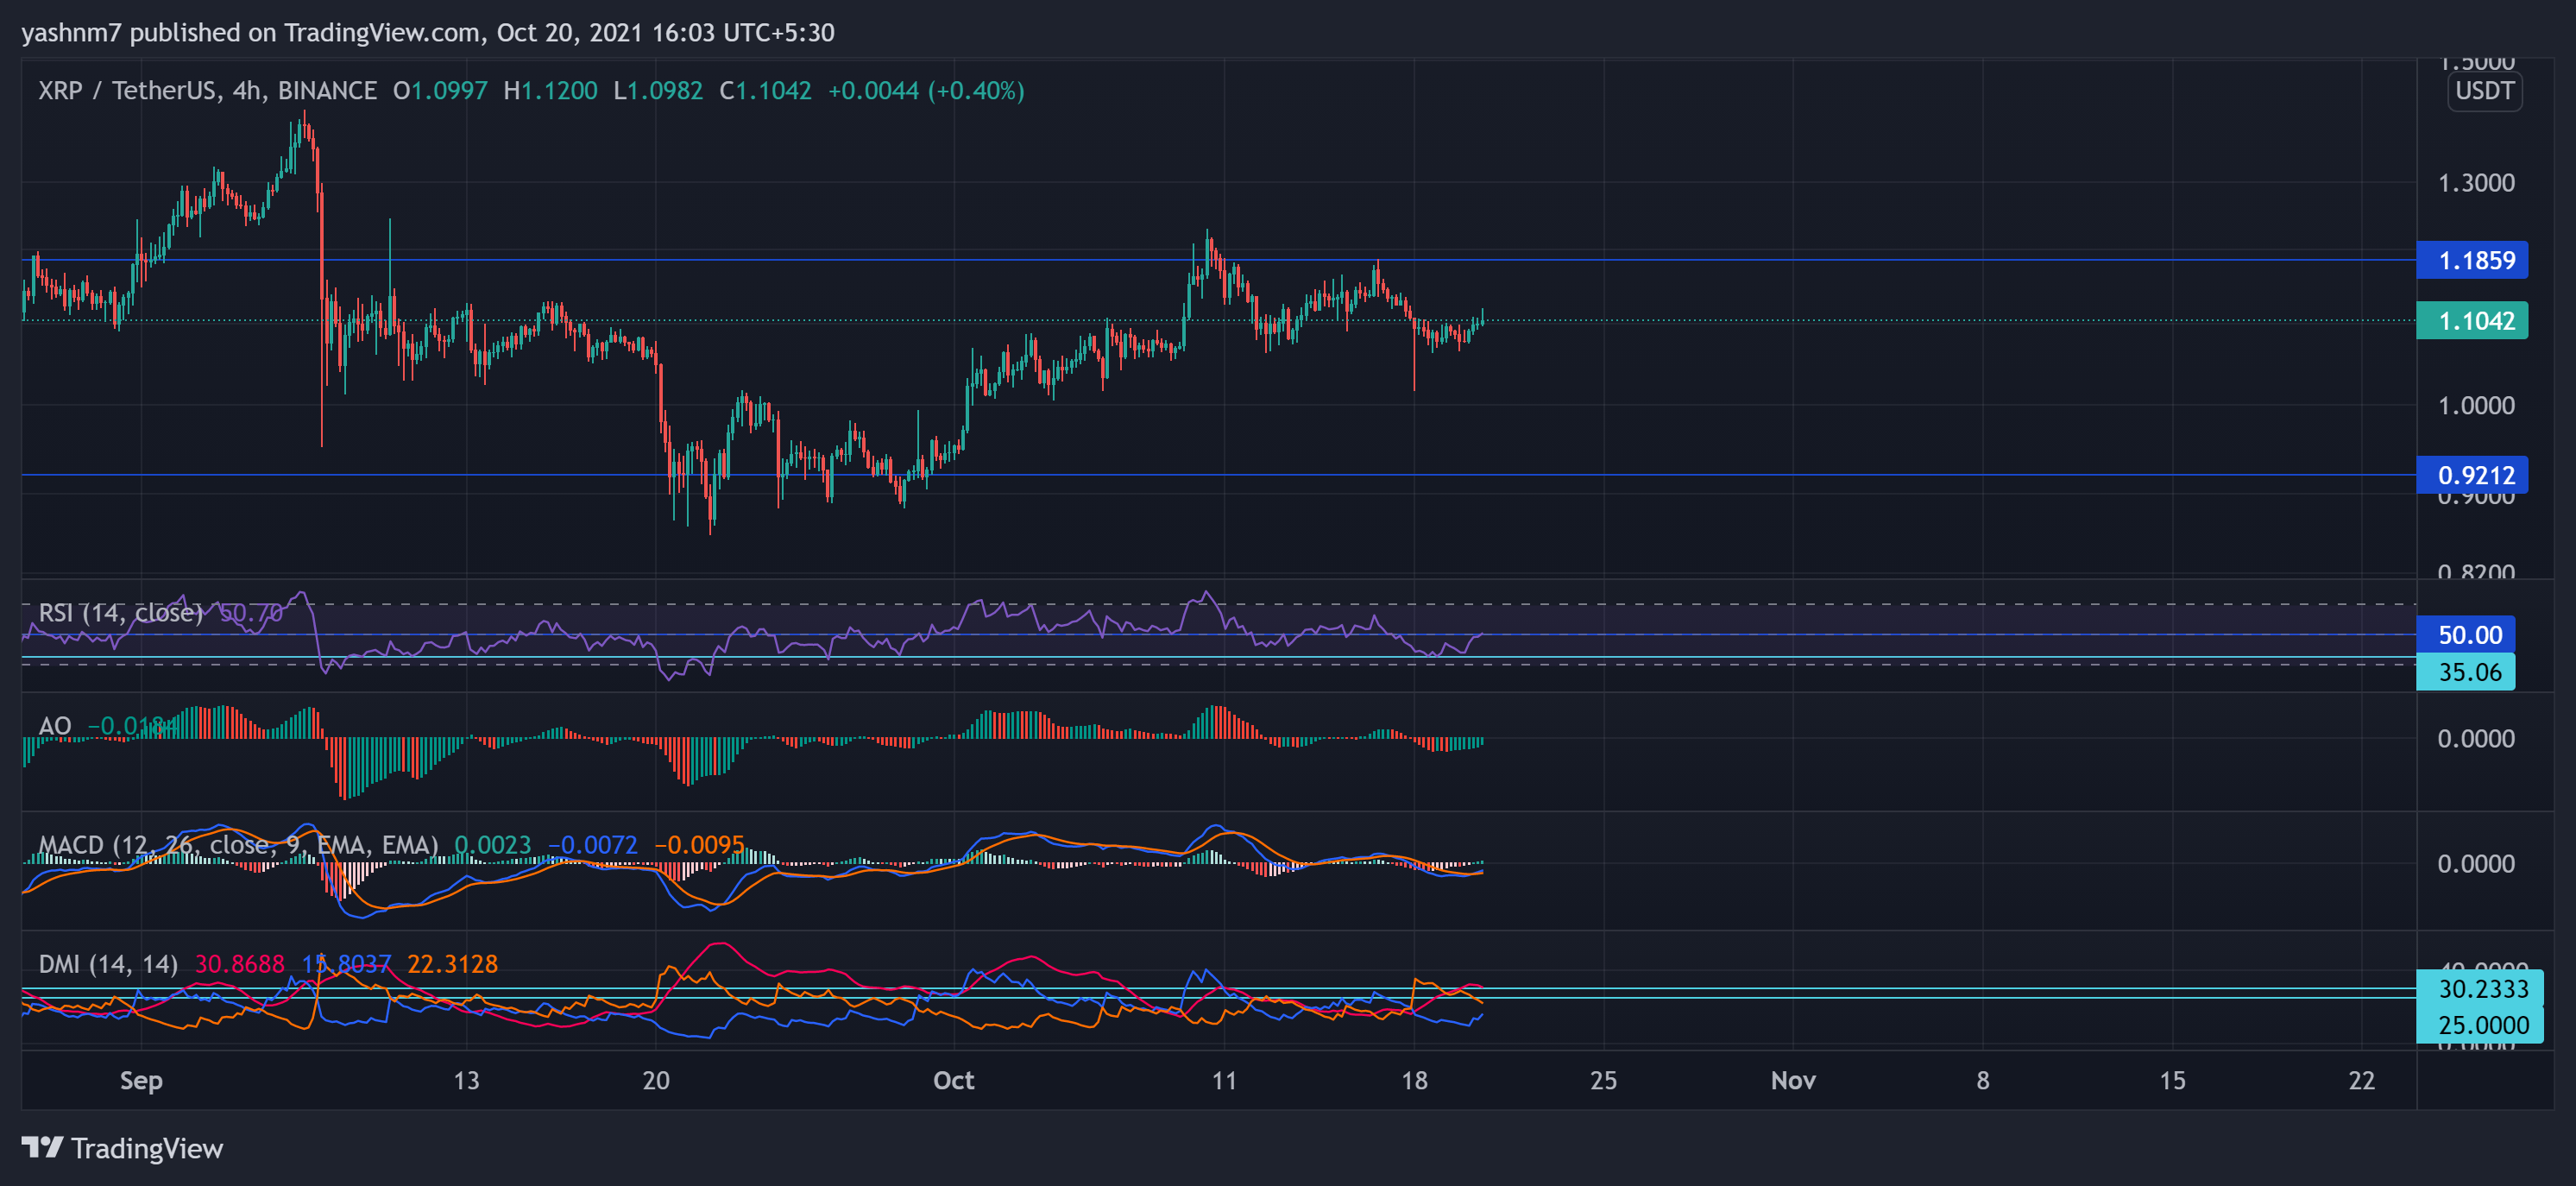
XRP displayed consolidation at $1.1042 within its resistance and support levels, which stood at $1.1859 and $0.9212, respectively. It appreciated by 1.09% over the past 24 hours. The key indicators pointed towards buyers’ momentum.
After plunging to 35.06, the Relative Strength Index assumed a forward trajectory towards the middle line. This reading indicated that bulls were taking over the price momentum. After a bullish crossover of the MACD (blue) and the Signal Line (orange), MACD agreed with the buyers’ strength by heading north towards the half-line.
The MACD histogram and Awesome Oscillator obliged to the increasing buying pressure by flashing green signal bars. The Average Directional Index (red) stood at 30.23, which depicted a strong directional trend in the near term.
EOS
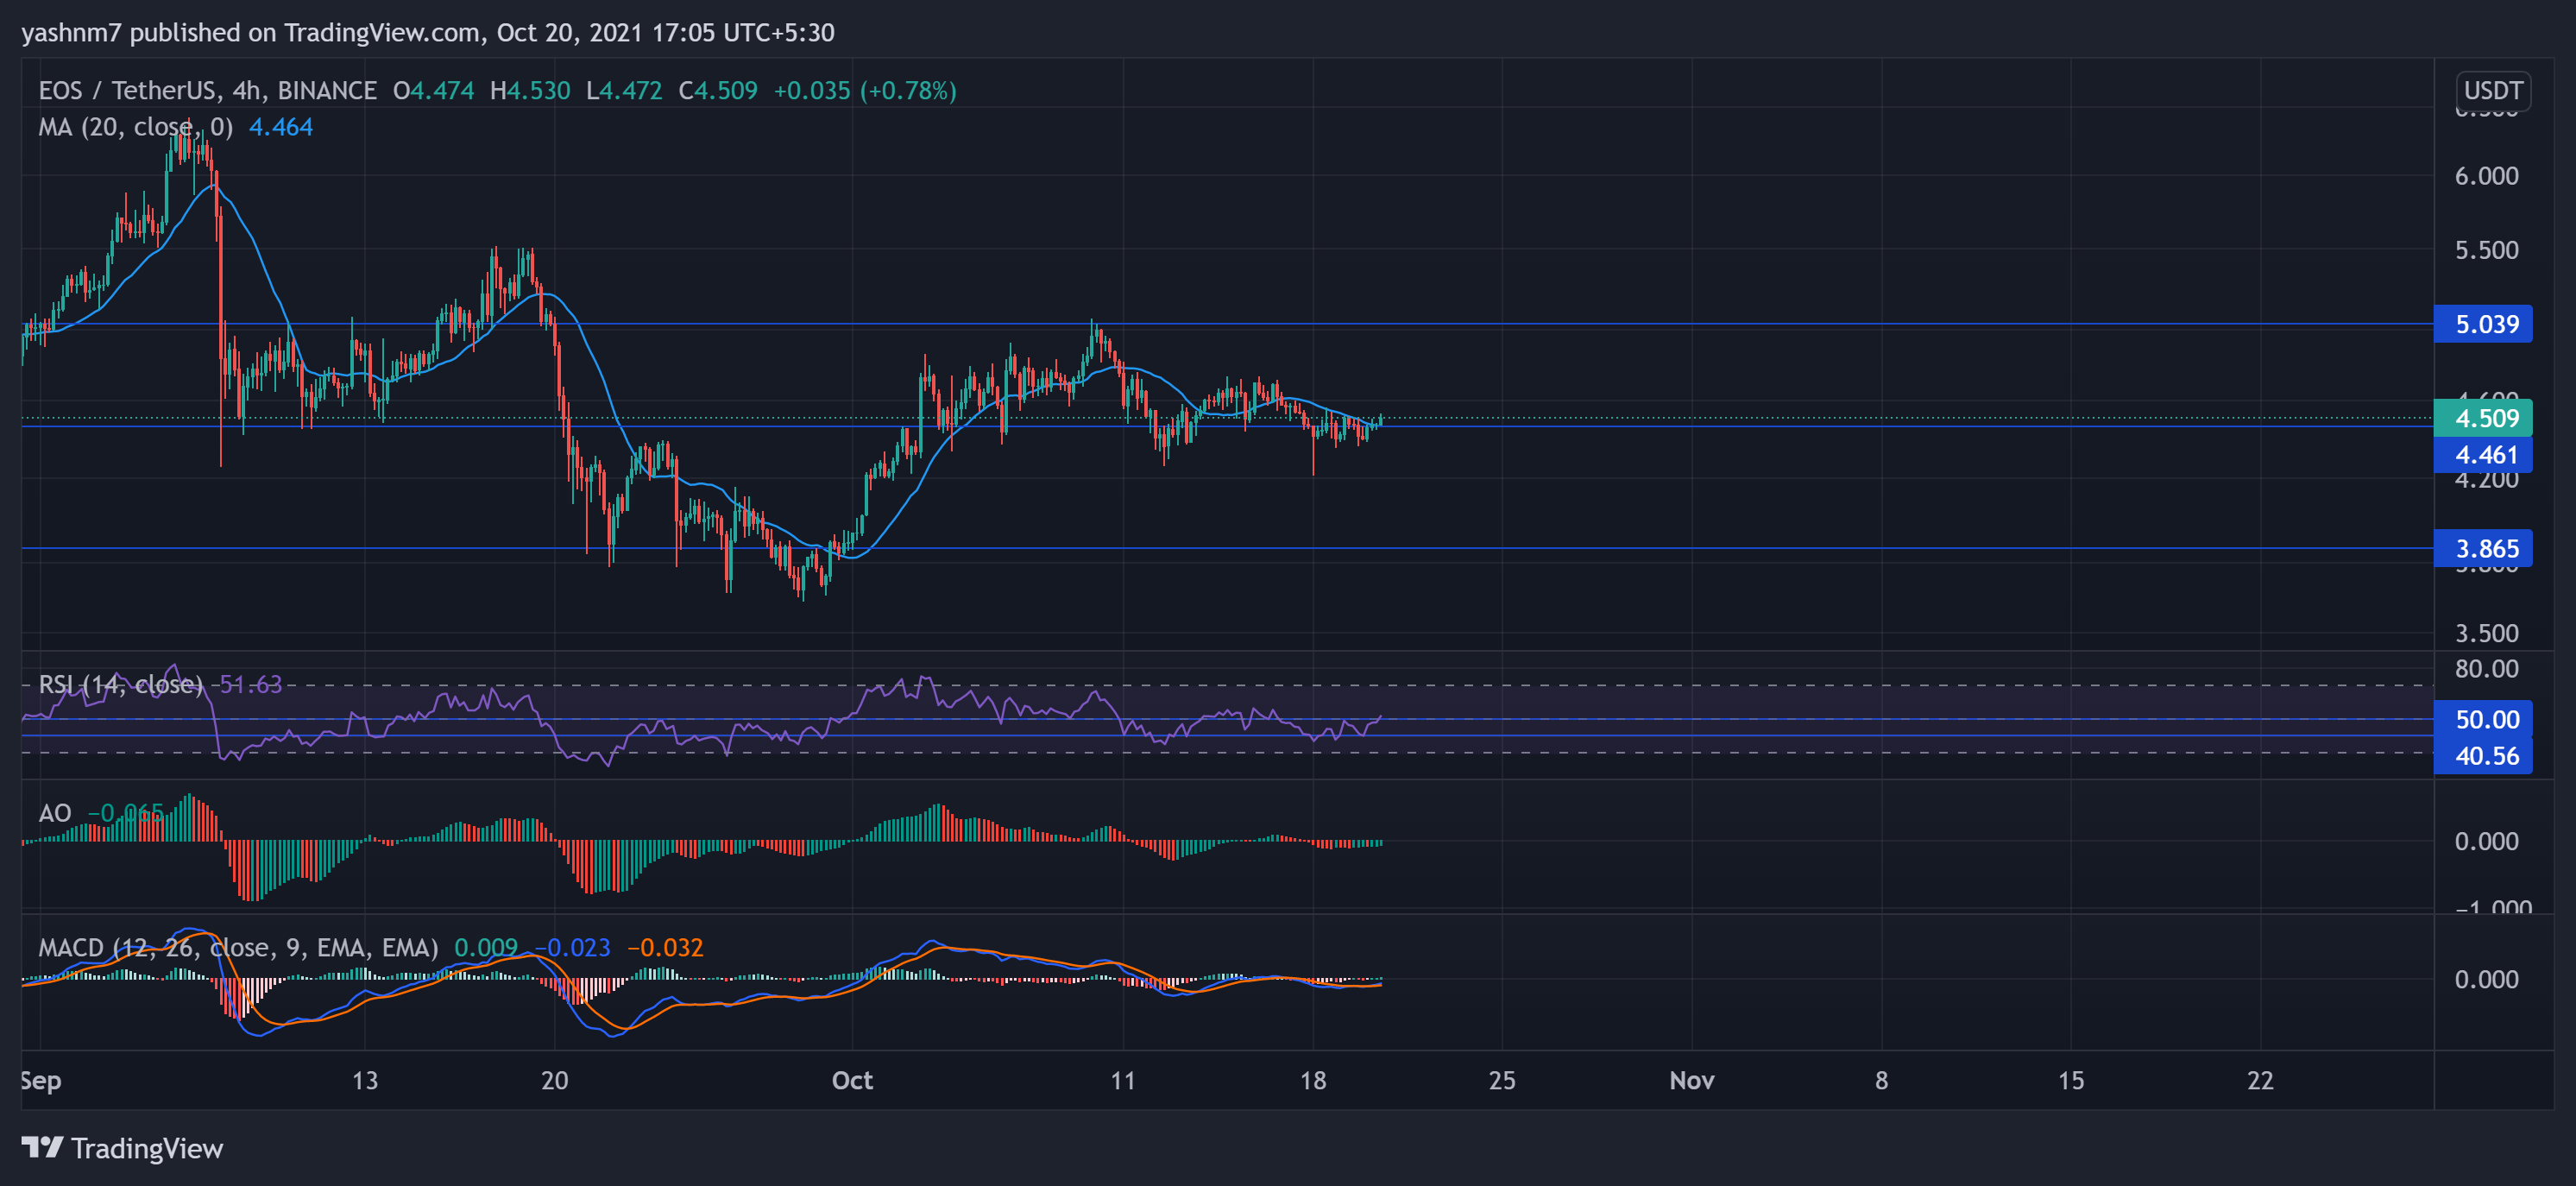
EOS rose by 0.79% over the last 24 hours on its chart and traded at $4.509 at the time of analysis. The price assumed consolidation within its immediate resistance and support levels that stood at $5.039 and $3.865, respectively.
The price candlestick on the 4-hour chart was above the 20-SMA Level that stood at $4.461. This reading implied a strong momentum in favor of bulls. The Relative Strength Index rapidly ascended from 40.56-mark towards the north and crossed the middle line, continuing to head in that direction.
This analysis indicated a higher buying strength. The MACD (blue) and the Signal Line (orange) converged. With the MACD heading upwards after convergence, it pointed at a gradual increase in buyers’ strength in the market.
The Awesome Oscillator was below the zero line, which depicted a downtrend in recent times. However, the second peak of the AO histogram was higher than the first, hinting at bullish tendencies.
Avalanche (AVAX)
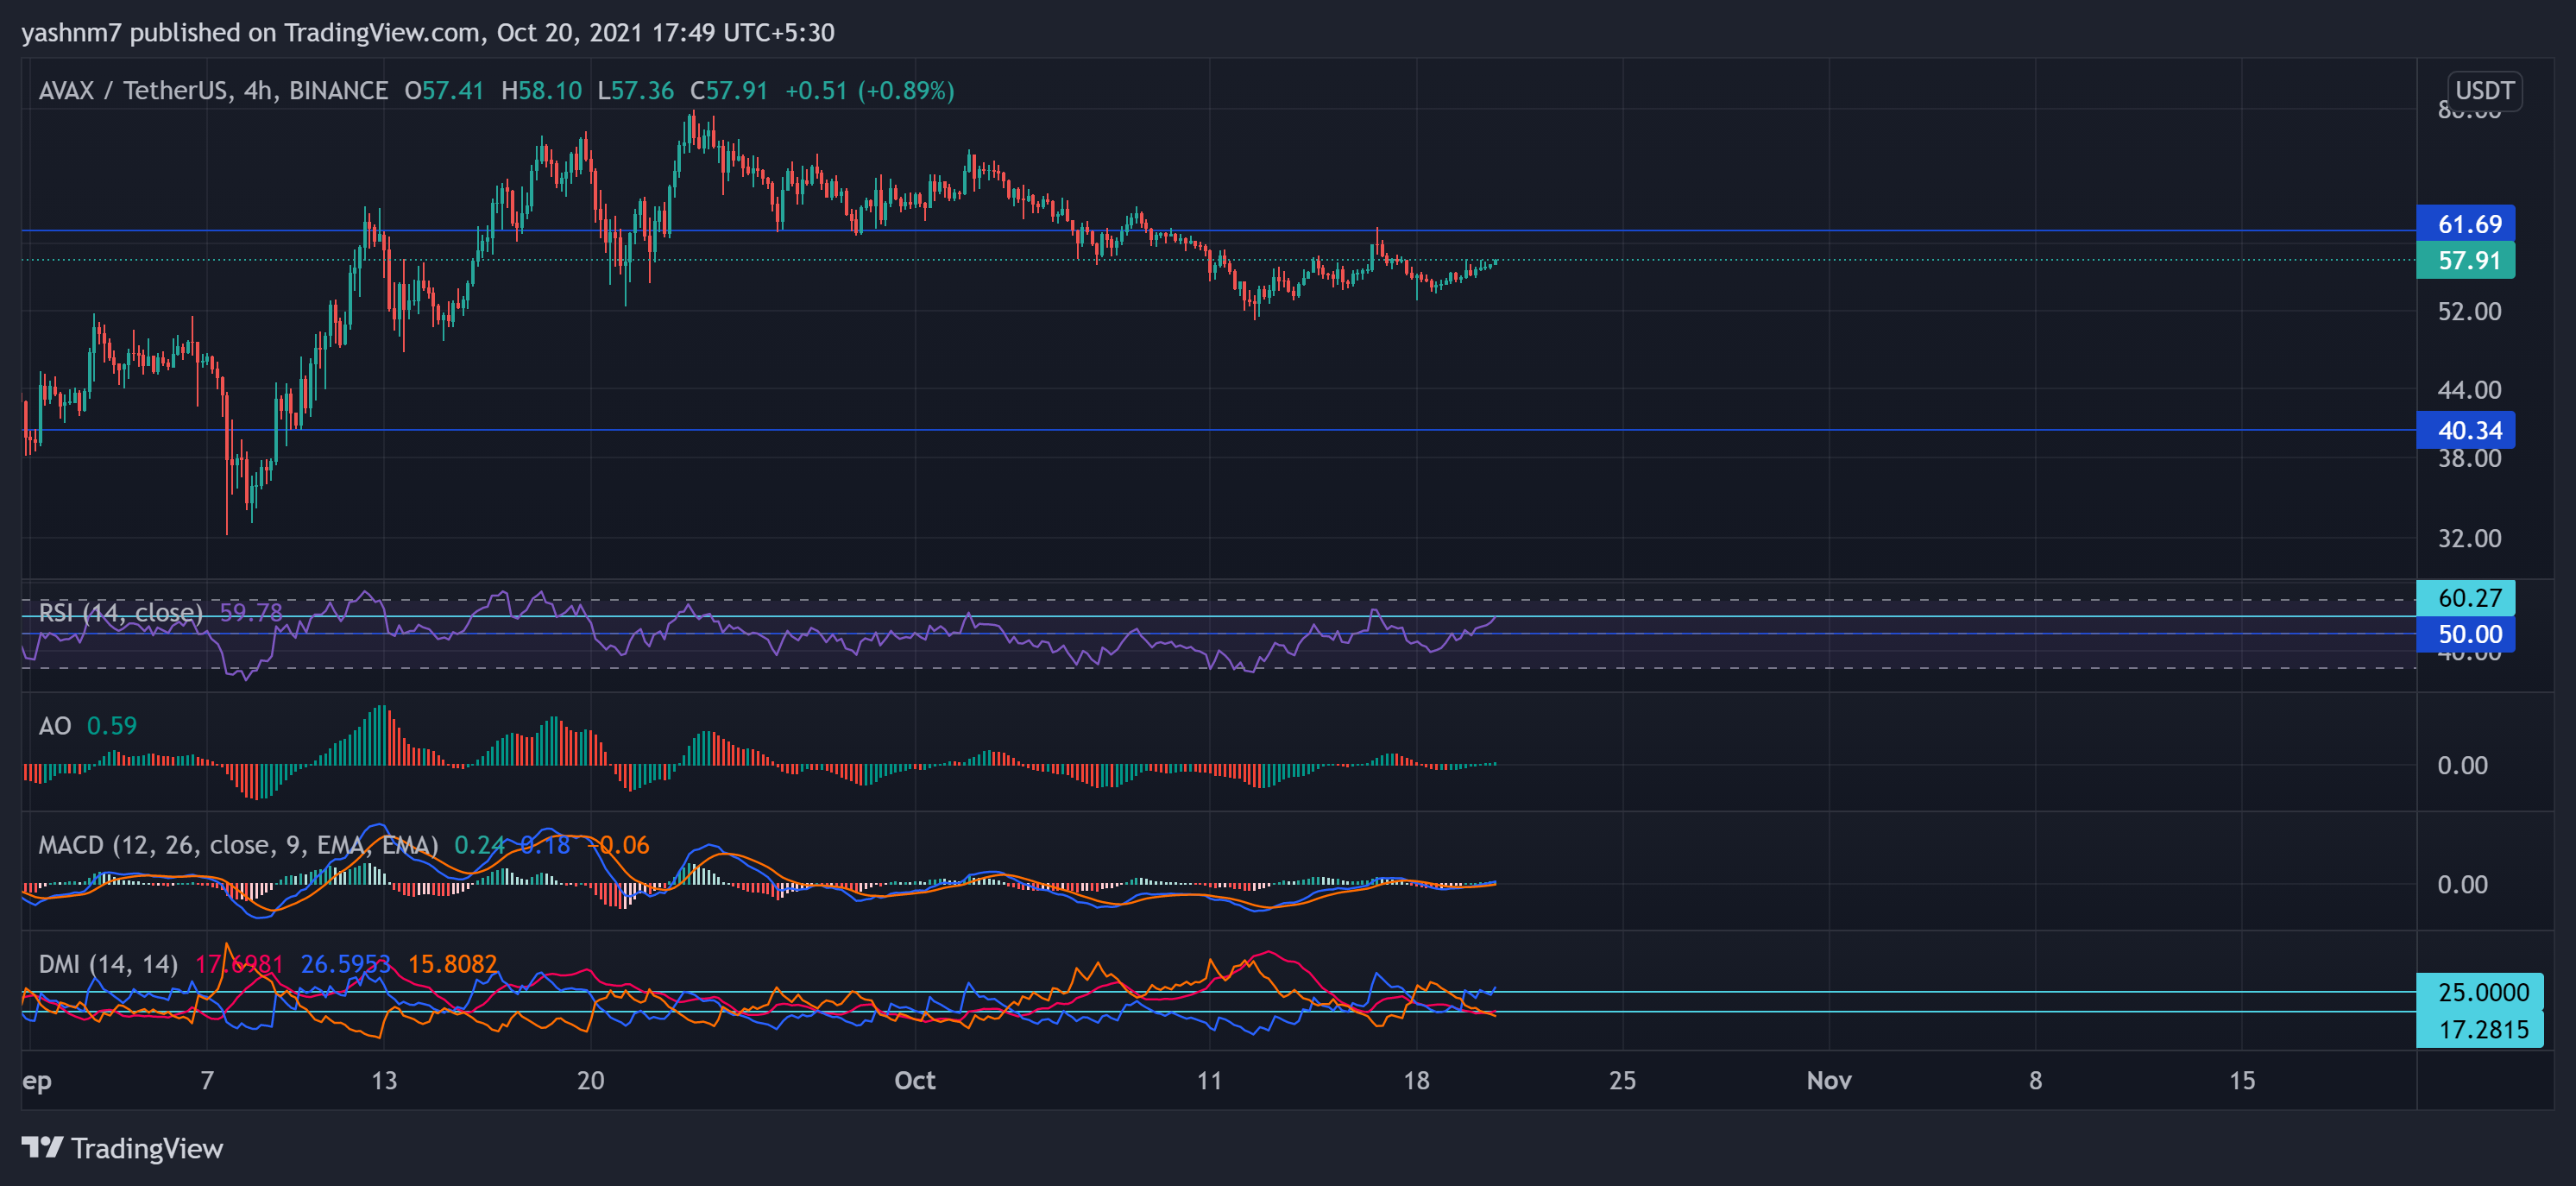
AVAX surged by 2.43% over the last day. The altcoin was trading at $57.43 at the time of reporting. It approached its resistance level, which stood at $61.69, while its support level stood at $40.34.
The principal indicators pointed towards a bullish price trajectory. An increase in Relative Strength Index visibly showed high buying strength after reaching the 60.27-mark, heading towards the overbought territory if the buying pressure sustains.
The green signal bars with higher peaks on the Awesome Oscillator and MACD histogram confirmed the existence of bullishness. However, the ADX (red) stood at the 17.2815 mark, pointing at the weakness in the current directional trend.


