XRP, Ethereum Classic, Dash Price Analysis: 12 June

XRP’s descending triangle presented the threat of another 20% decline from $0.79. Ethereum Classic could find support around the $50-mark. Finally, Dash could revisit $120 or even $109, before attempting a bullish comeback.
XRP

Source: XRP/USD, TradingView
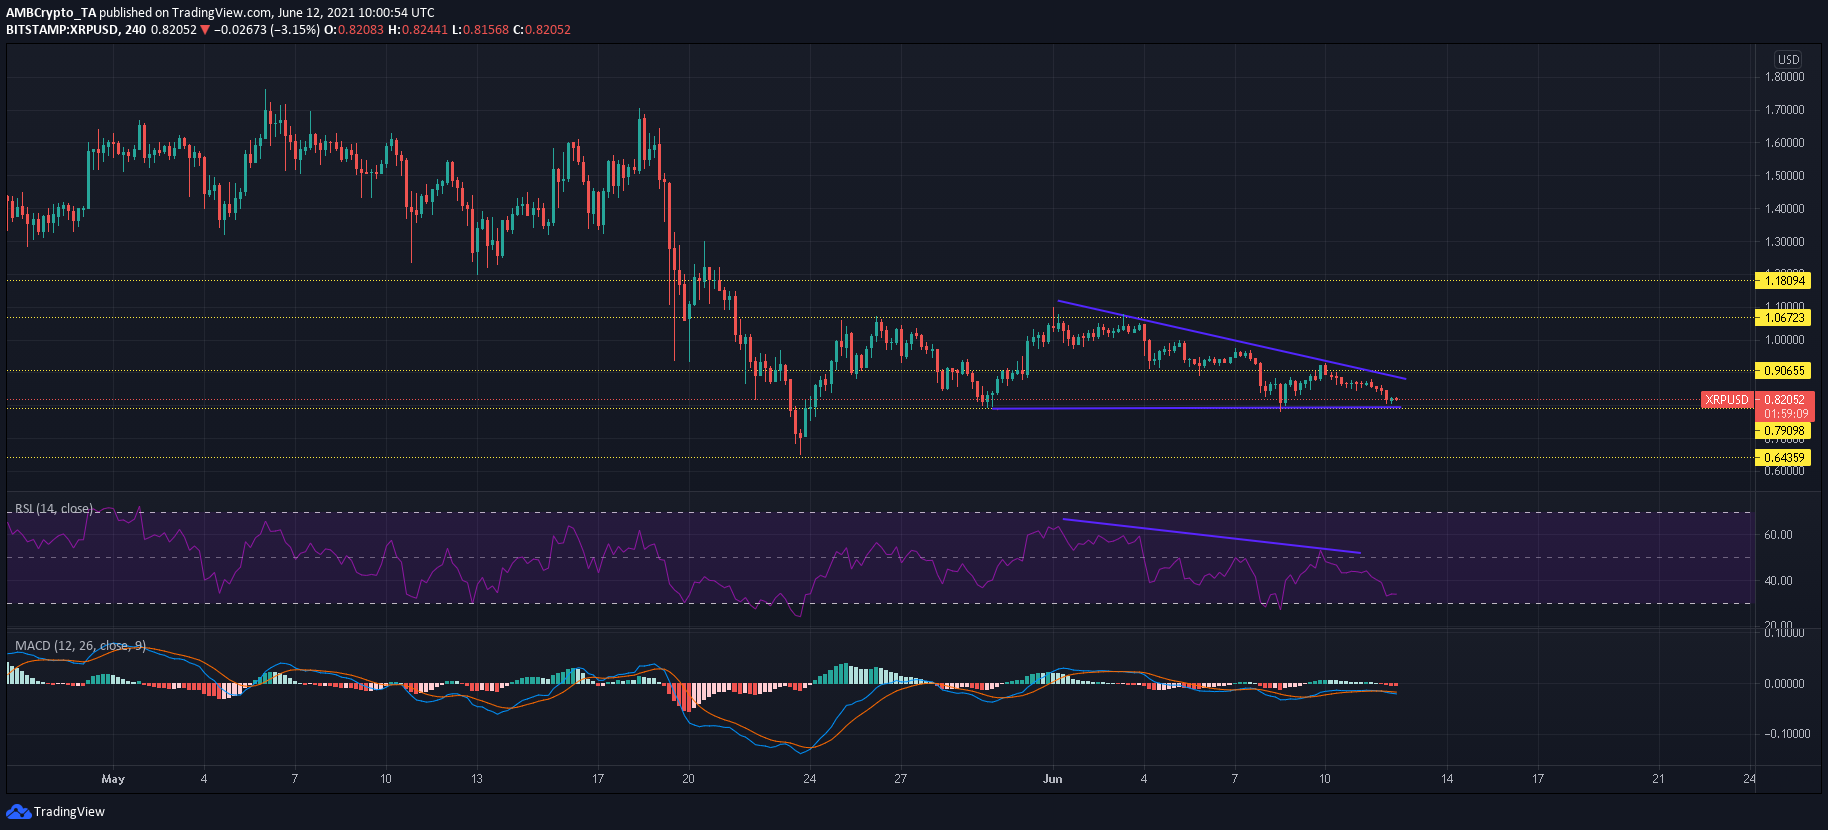
Since XRP’s run from $0.79 to $1.05 in end-May, the market has been under constant selling pressure. The price formed four lower highs on its descent from the $1-mark, one which led to the formation of a descending triangle. The support at $0.79 formed the base of XRP’s bearish pattern and the threat of a breakdown loomed large.
The RSI’s downtrend highlighted weakness in the market but on the plus side, a reversal was in order. Such an outcome could see XRP tread above its press-time support over the next few sessions. Conversely, a delayed stay in the oversold zone could heighten losses for the world’s seventh-largest cryptocurrency and another 20% retracement lay in its wake.
Despite a bearish crossover, the MACD line was not too distant from the Signal line as the bulls maintained XRP within the pattern.
Ethereum Classic [ETC]

Source: ETC/USD, TradingView
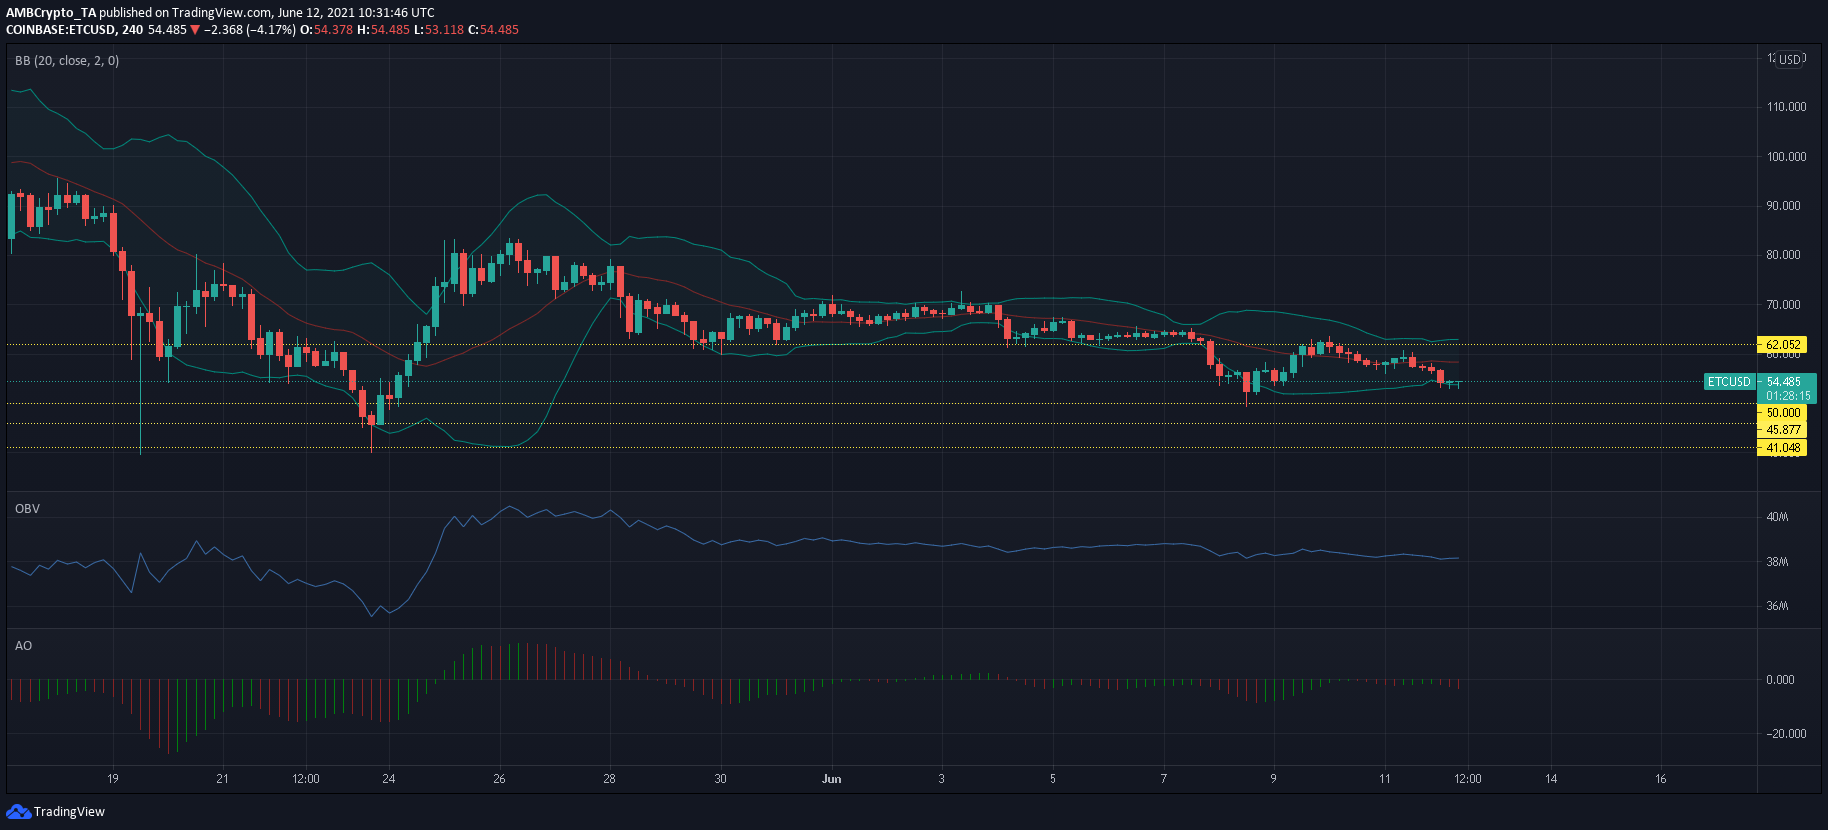
Ethereum Classic’s announced Magneto upgrade did not have an immediate impact on the altcoin’s price on the 4-hour timeframe. A look at its chart showed that the cryptocurrency instead moved south and towards the defensive line at $50 on the back of a broader market correction.
The candlesticks traded on the lower band of the Bollinger Bands and a hike in volatility could heighten losses moving forward. ETC’s demand zone lay between $41-$46 and the same would be in focus in case of a breakdown from $50. Bearish momentum was building up on the Awesome Oscillator as the focus shifted to ETC’s next defensive line.
Dash [DASH]

Source: DASH/USD, TradingView
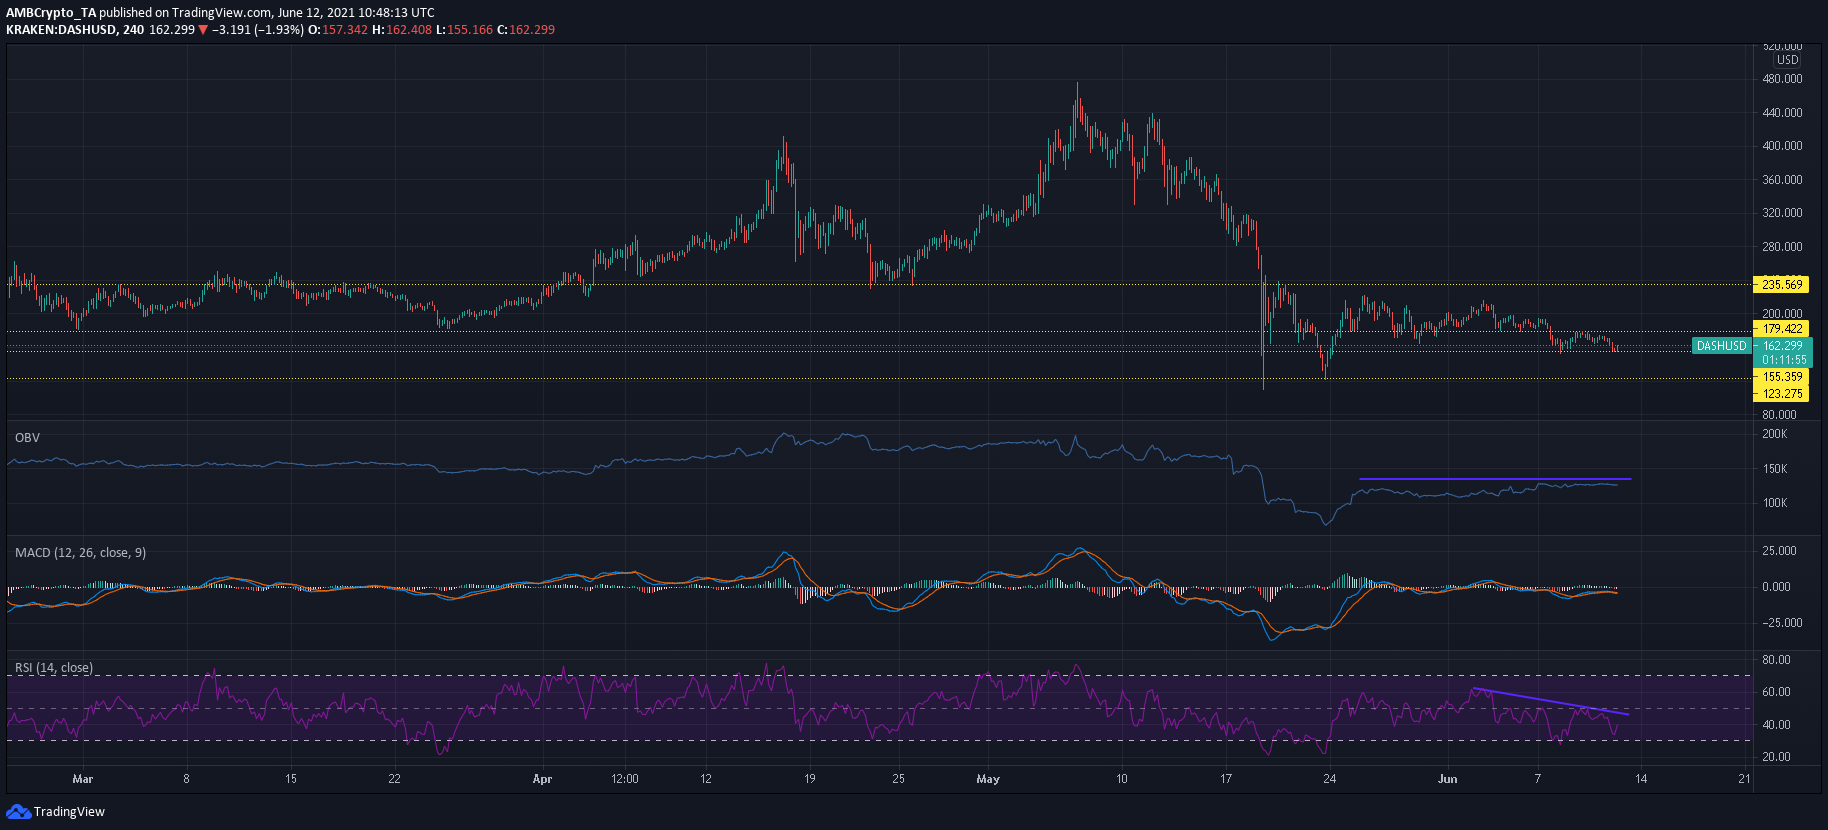
Dash’s bears attempted to breach the $155-support, at the time of writing, and it would be doubtful whether bulls could contain the selling pressure. Lower highs on the RSI indicated weakness and the upper sloping trendline could contain the index in bearish territory. This could translate to an eventual breakdown, one which could see DASH revisit levels seen post 19 May crash of $120 and $109.
While the OBV moved flat-like over the past three weeks, buying volume had almost equaled selling volume. This buying pressure could act as a cushion against an extended sell-off below $109.


