XRP holders, here’s what you should expect next week
AMBCrypto’s analysis of XRP's price movements hinted at the possibility of a further decline in the altcoin’s value.
- XRP’s price has risen by just 1% in the past week.
- Key technical indicators hint at further decline in the altcoin’s value.
Ripple’s native token XRP has failed to register any significant price rally, despite the general market uptick in the last week.
During that period, Bitcoin’s [ BTC] price growth above the $70,000 price mark led to an overall surge in the crypto market.
According to CoinGecko’s data, the global cryptocurrency market capitalization has increased by 8% in the past seven days. At press time, this was $2.8 trillion.
XRP trends in an opposite direction
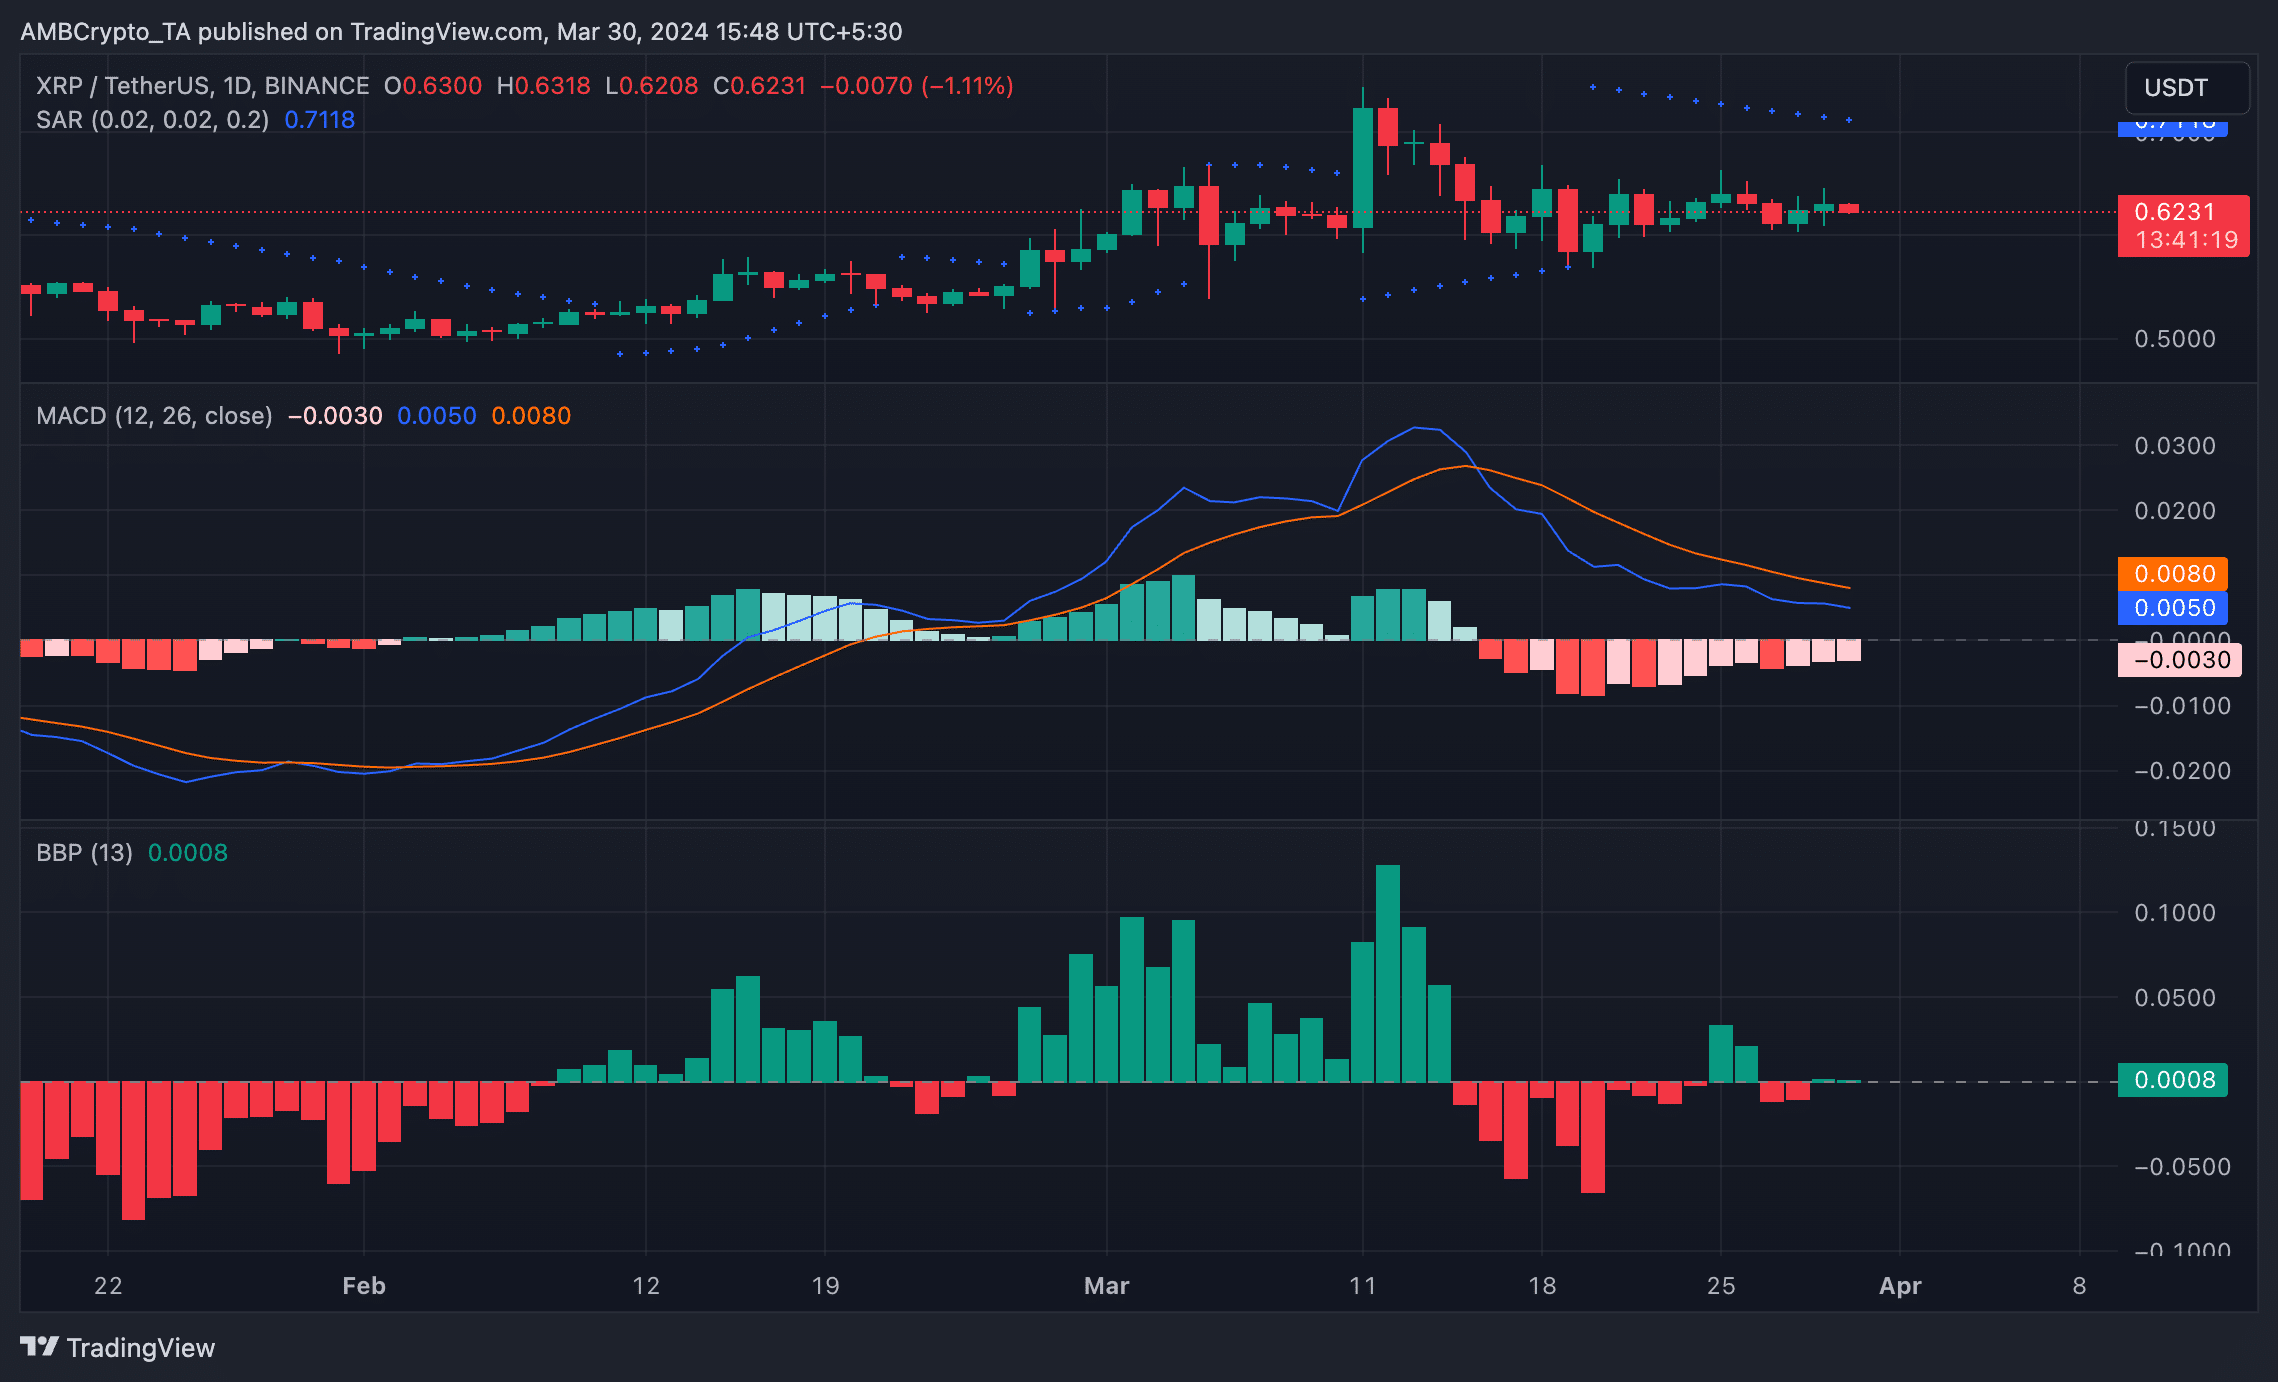
As of this writing, XRP exchanged hands at $0.62. Per CoinMarketCap, its value has seen a mere 1% increase in the past seven days.
AMBCrypto’s readings of its price movements on a 1-day chart hinted at the possibility of a further decline in the altcoin’s value.
Firstly, XRP’s price rested below its Parabolic SAR indicator at the time of writing. Traders use this indicator to determine potential reversal points in the price direction of an asset. It is made up of dots that rest above or below an asset’s price on a chart.
When the dots rest below the price, they suggest a bullish trend. Conversely, when they are positioned above the price, as is the case here, the market trend is bearish. This also suggests that the price decline is likely to continue.
XRP’s MACD line was spotted below the signal line, confirming the current bearish trend. Ushering in the bear cycle, the MACD line intersected the signal line on 16th March, and XRP’s value has since dropped by almost 10%.
This intersection is considered bearish as it suggests that the short-term momentum of the asset’s price is weakening relative to the longer-term momentum. Traders often consider it a sign to exit long positions and occupy short ones.
Further, XRP’s Elder-Ray Index, which estimates the relationship between the strength of buyers and sellers in the market, has been significantly negative in the past two weeks.
How much are 1,10,100 XRPs worth today?
This indicated that selling activity has outpaced accumulation among market participants.
Regarding XRP’s performance on the derivatives market, its Futures Open Interest has fallen slightly by 0.3% since 13th March. This suggests that a sizeable number of contracts have been closed as traders exited the market to prevent losses.