XRP is caught in a wave of selling that could take it to…

Disclaimer: The findings of the following analysis are the sole opinions of the writer and should not be considered investment advice
XRP has been on a strong downtrend since November when it hit highs of $1.34. The weeks that followed saw the $1 area lost to the bears. At press time, the $0.76 area of former demand, which saw a weak bounce for XRP, appeared to have been flipped to a region of supply as well.
There were some levels of support to the south. And yet, alongside the rest of the market, it looked like the downtrend was here to stay for a while longer.
In other news, some new litigation was brought forward in the U.S SEC vs Ripple Labs case.
XRP- 12 hour chart
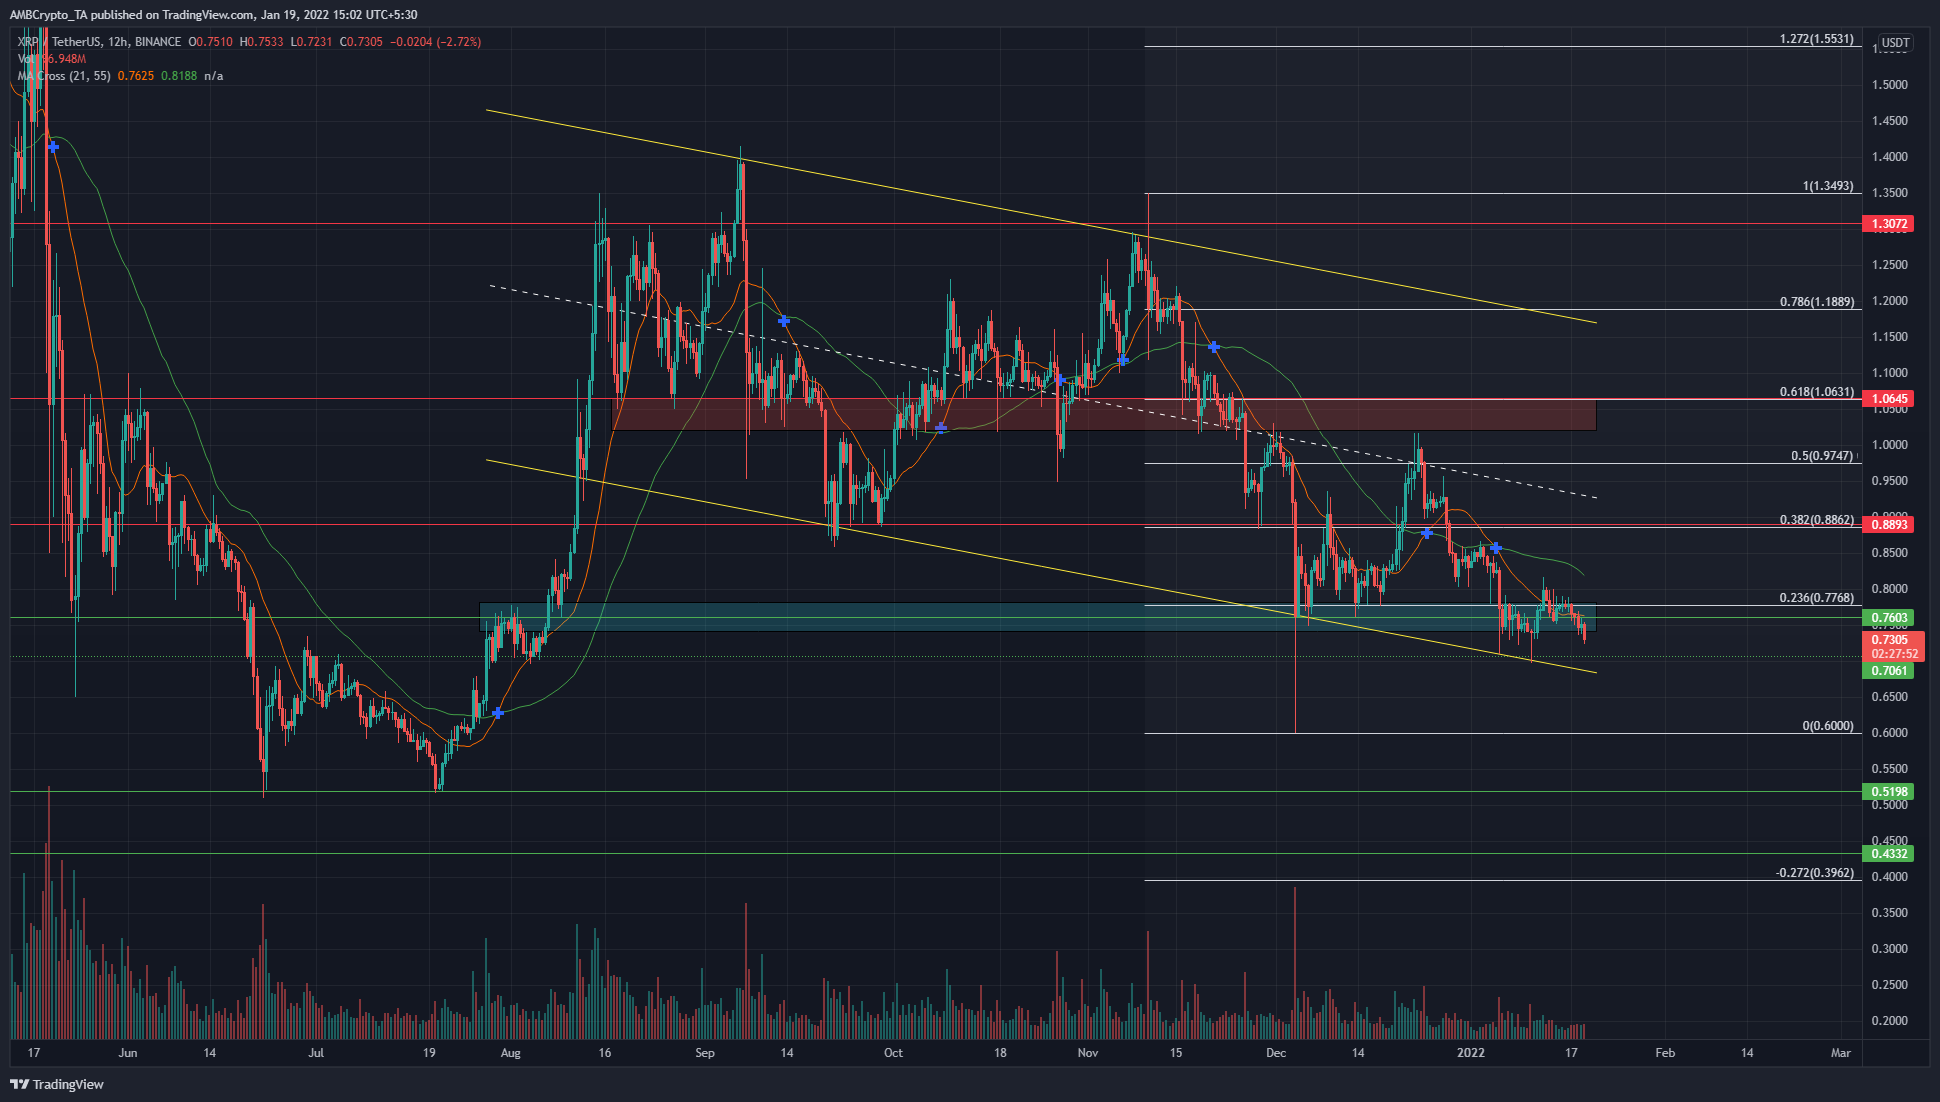
On the 12-hour chart, XRP was trading within a descending channel (yellow). This channel was established when the price was unable to push past the $1.25-level, marking a series of lower highs and lower lows that we see as a channel on the chart.
The market structure was bearish. To break this, a higher low has to be formed and the price has to close above the $0.85-level. This did not look likely to happen in the next few days, although this development cannot be ruled out.
The bottom of the channel has seen the price bounce decently. And, it could climb as high as the mid-point of the channel (dotted white), provided the rest of the market’s short-term outlook also flips bullish, especially Bitcoin.
The channel lows notwithstanding, the price could find support at $0.6 and $0.51-levels in the weeks to come.
Rationale
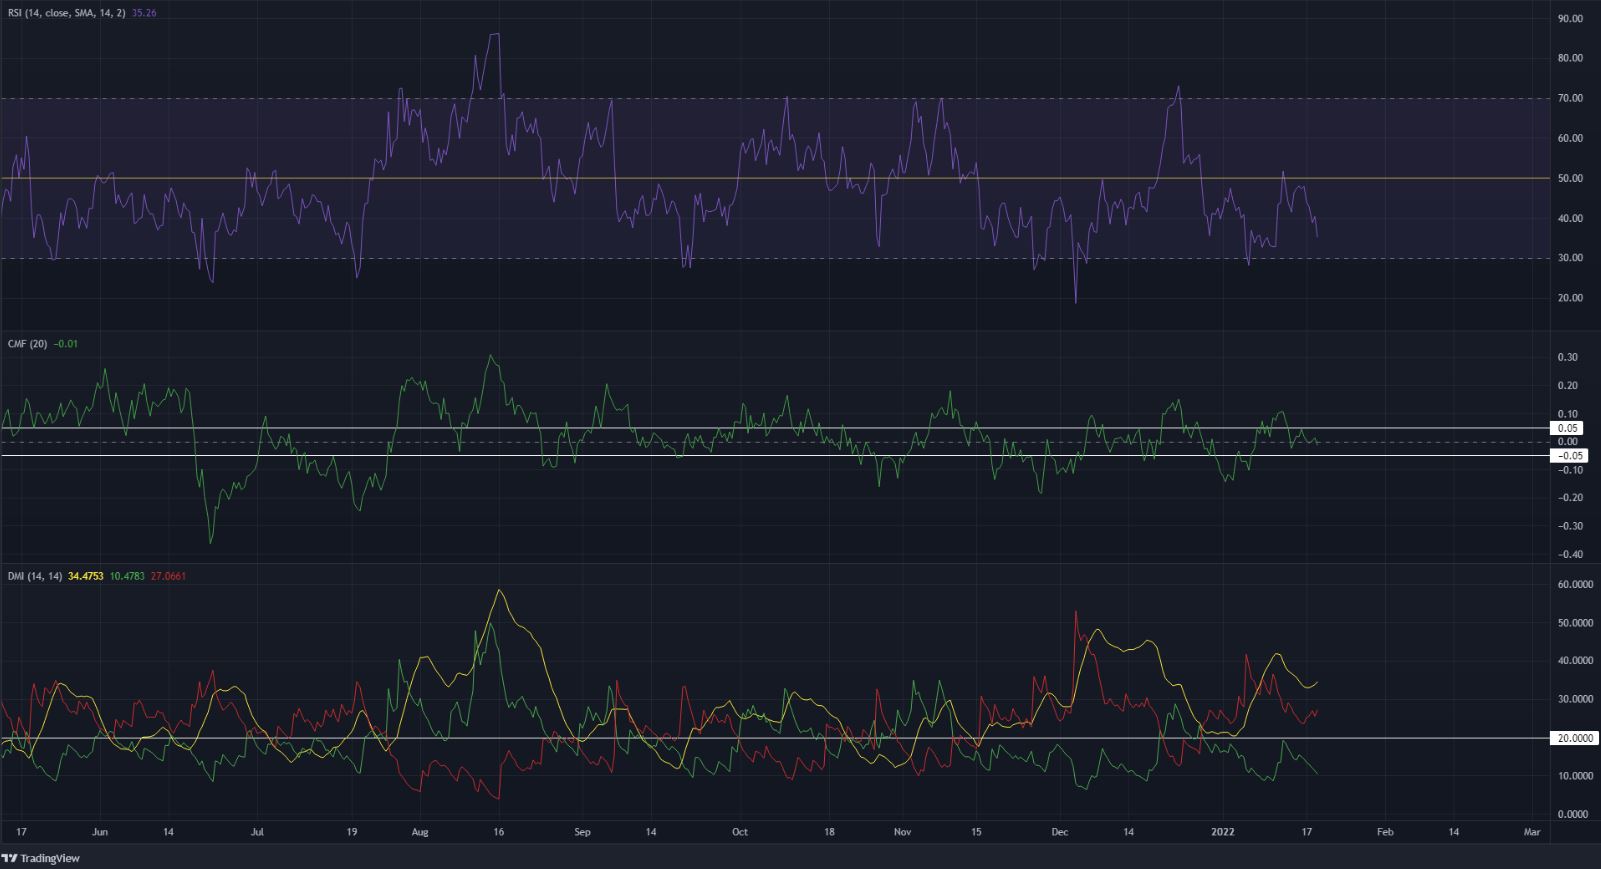
The RSI has been below neutral 50 for the past four weeks, which signified a downtrend in progress. Bearish momentum was rising at press time, and another visit to $0.7 looked likely.
The CMF was at zero, and in this zone, it did not signify significant capital flow into or out of the market. A move below -0.05 can be used as confluence, alongside levels on the chart, to expect a sharp move south.
The Directional Movement Index also pictured a strong bearish trend in January as both the ADX (yellow) and the -DI (red) were both well above 20.
Conclusion
Taken together, any rallies XRP can experience are a selling opportunity. This would continue to be the case until the previous lower high has been broken and retested to find demand.
Until such a time, XRP can be expected to shed value and could fall as low as $0.6, $0.51, and even lower in the months to come.


