XRP, NEAR, Gala Price Analysis: 20 January

XRP bounced back from its five-month support after its CMF formed a bullish divergence with price. Furthermore, GALA saw a reversal pattern on its 4-hour chart while flashing bearish near-term technical indications.
On the other hand, NEAR slowed down but found strong support at the $16.4-mark.
XRP
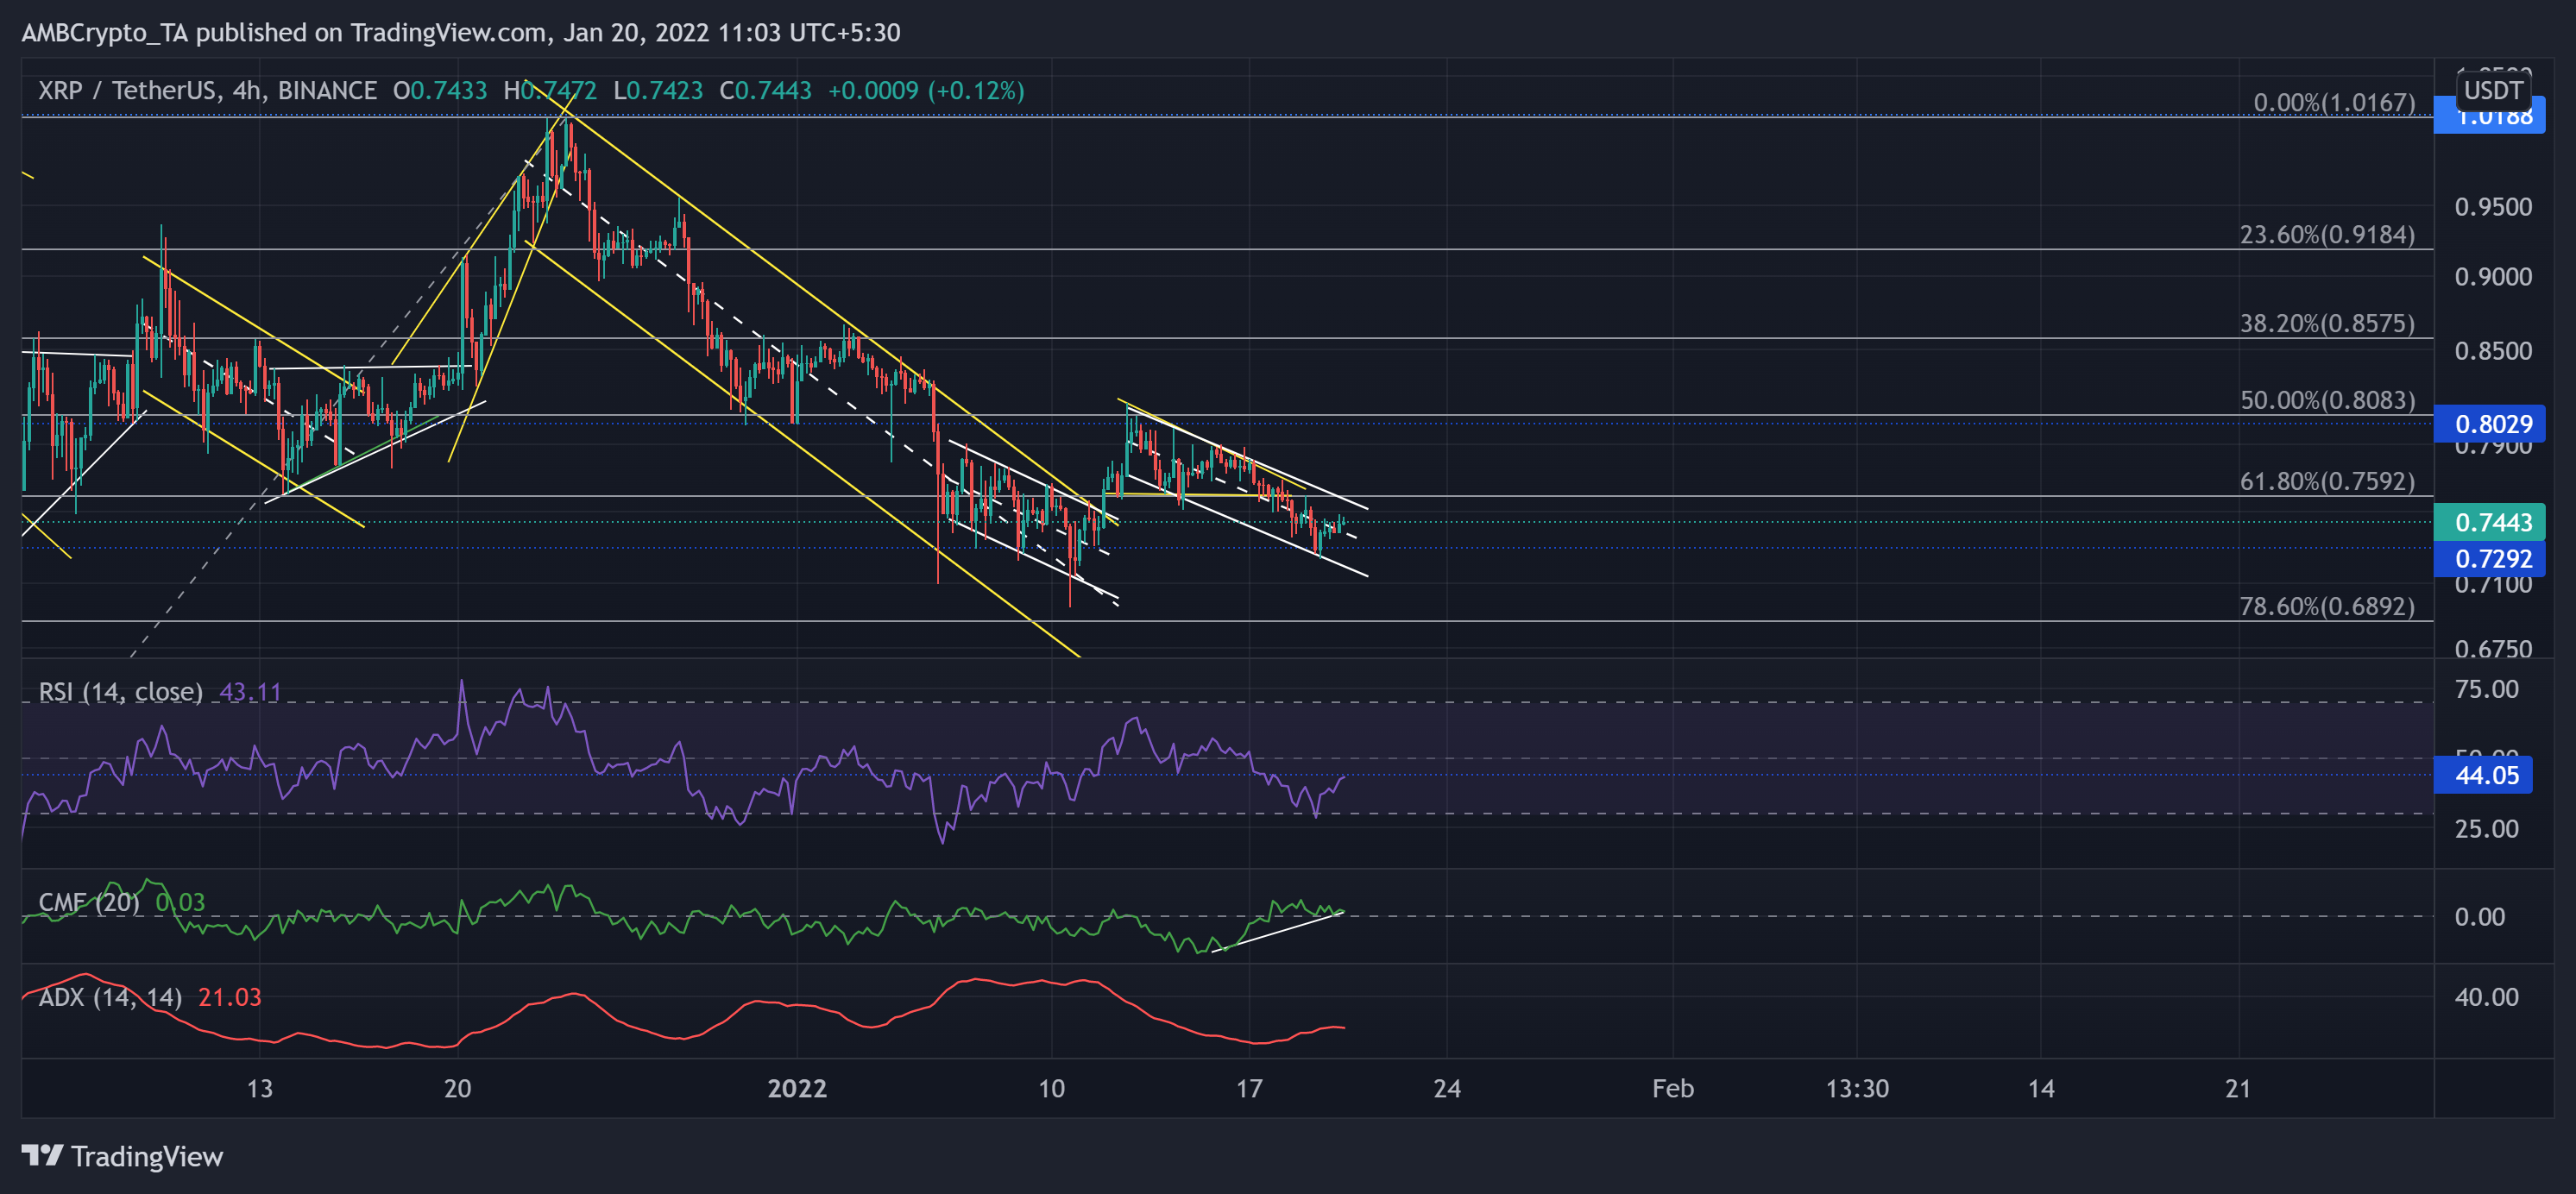
In an attempt to recover the 61.8% Fibonacci support, XRP managed to break out of the three-week down-channel (yellow). Then, as the sellers defended the $0.8029-level, the alt marked lower peaks while keeping the 61.8% support. During this phase, it formed a descending channel.
After finally losing the support at the golden level, the bulls stepped in at $0.7292-mark (five-month support) and eased the selling sentiment.
At press time, XRP traded at $0.7443. For the most part, the RSI and price seemed to be in harmony. After testing the oversold mark, it eyed to take on the 44-mark barrier.
Interestingly, the CMF was in an uptrend. It managed to claw back above the zero-line, giving the buyers an edge. Thus, forming a bullish divergence with price. Nevertheless, the ADX seemed to slow down and affirmed the existence of a weak directional trend for XRP.
Near Protocol (NEAR)
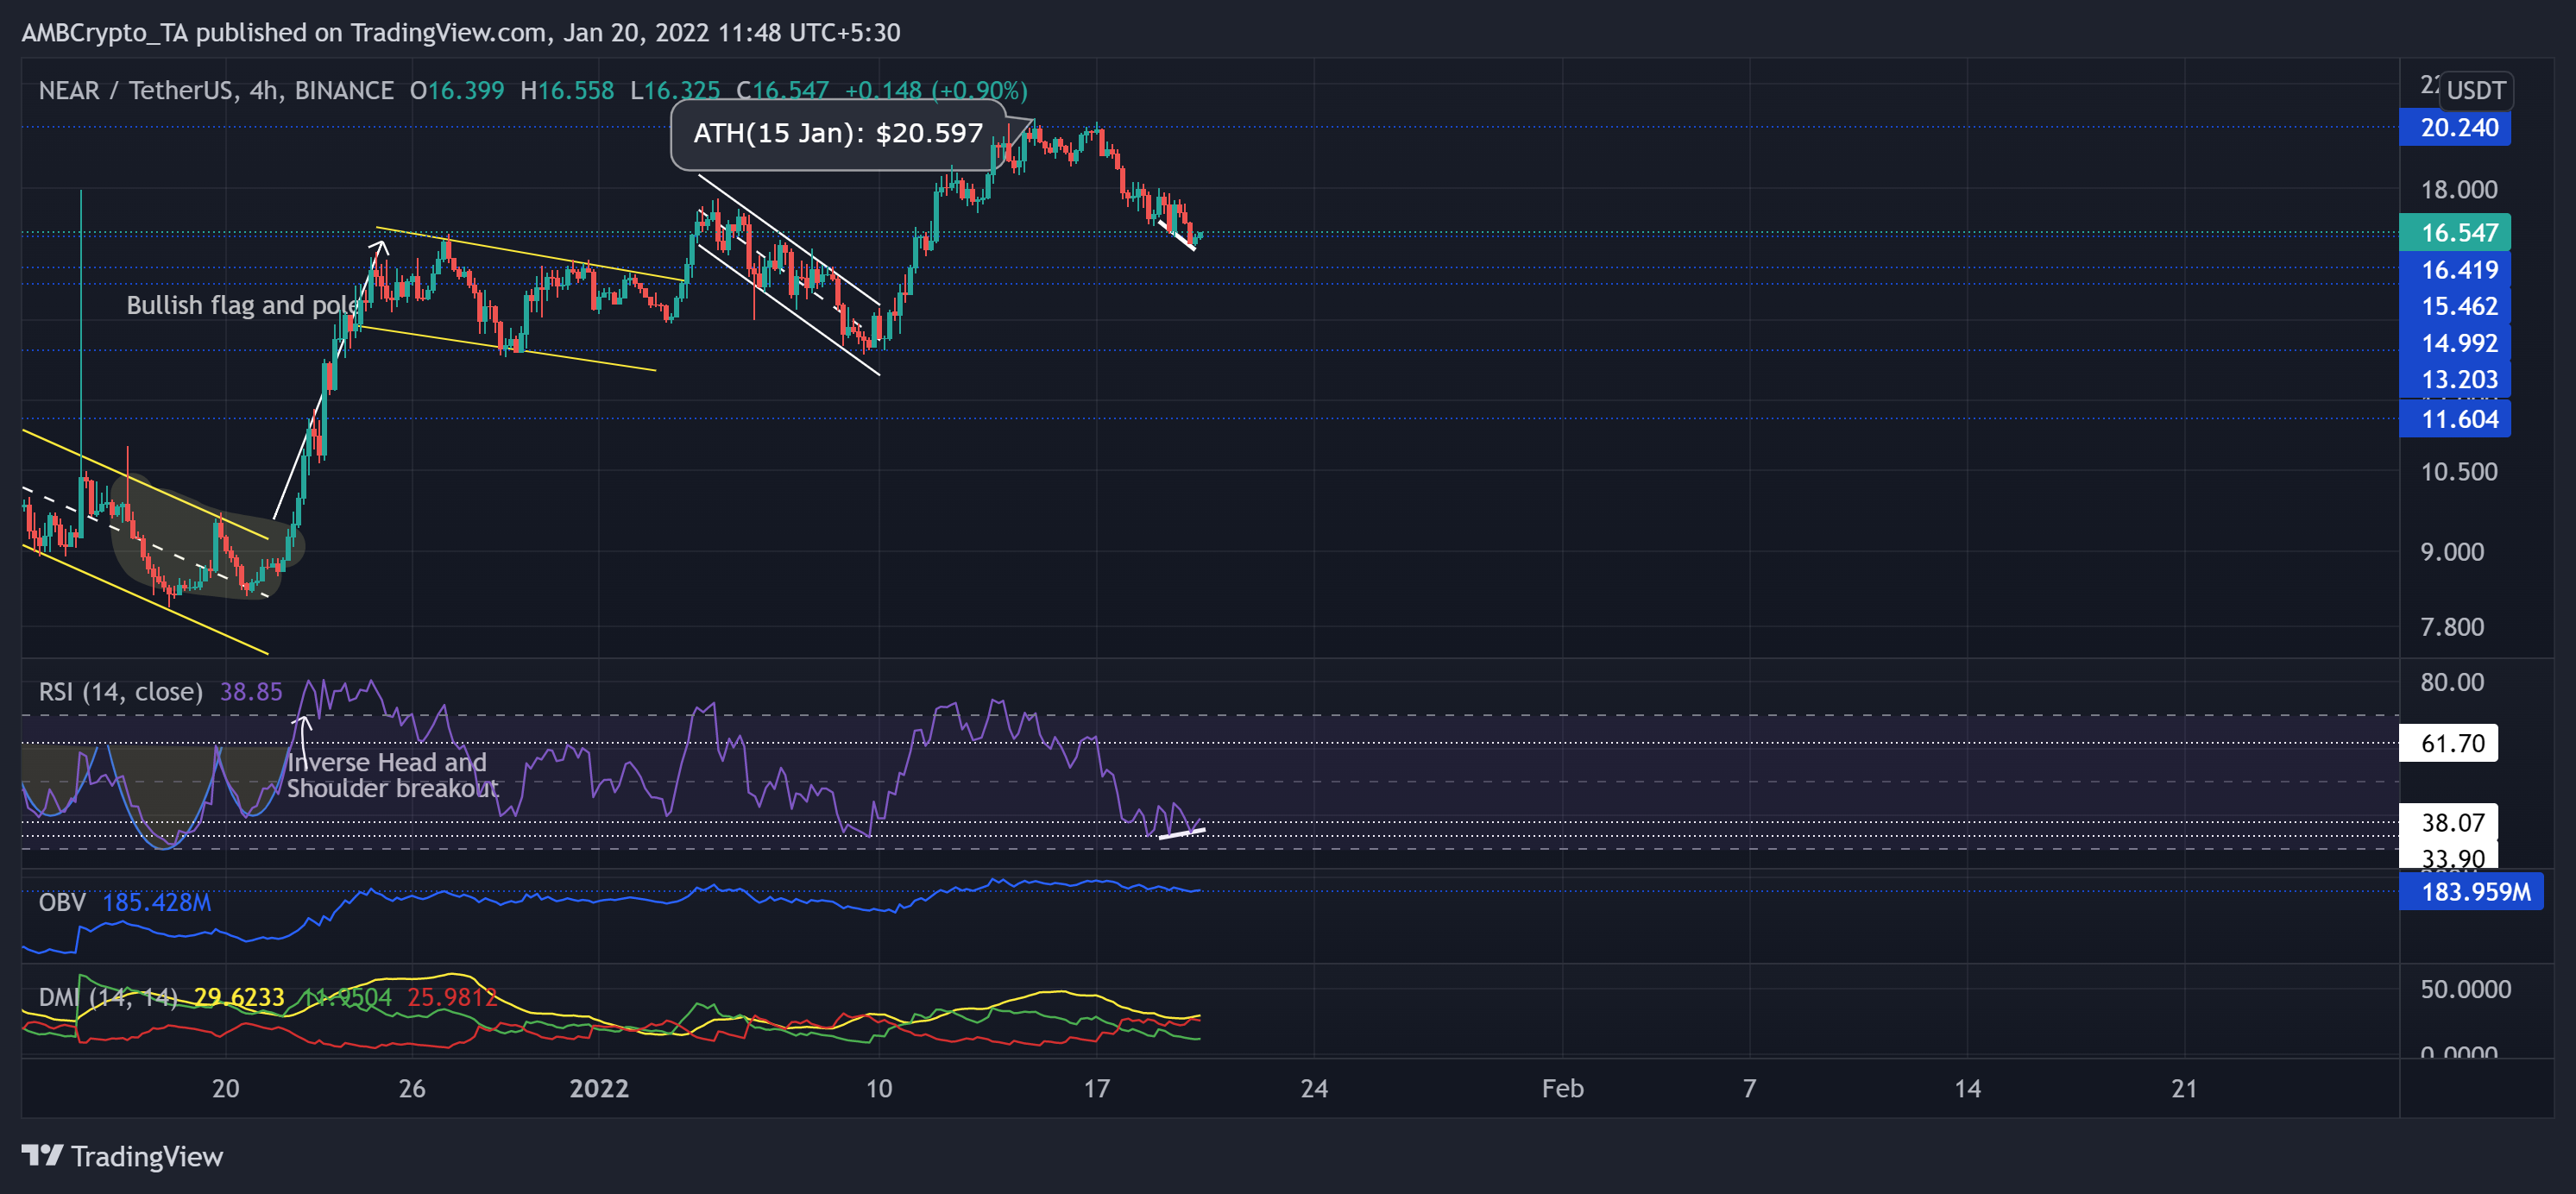
As the bulls ensured the $13.2-mark support, NEAR saw a down-channel (white) breakout on 10 January. After that, it entered into price discovery.
The alt saw an exceptional 56.7% ROI (from 10 January low) to poke its ATH at $20.597 on 15 January. Since then, it saw a pullback but found support at the $16.4-mark.
At press time, the alt traded at $16.547. After testing the 61-mark for six days, the RSI finally took a sharp 30 point plunge to test the 33-level support thrice in the last two days. Now, the RSI saw a bullish divergence (white trendline) with the price as it tried to sustain a close above 38.
The OBV maintained its immediate support that upheld higher prices over the past week. This reading entailed consistent buying pressure. However, the DMI continued to flash a bearish bias.
GALA

Since touching its ATH on 26 November, GALA persistently marked lower peaks and troughs while losing the 50%, 61.8% Fibonacci support. The recent down-channel (white) breakout reversed from the near-term supply zone (rectangle, green).
Now, GALA saw a falling wedge (yellow, reversal pattern) on its 4-hour chart. The immediate testing point for the bulls was at the 20-SMA (cyan).
At press time, GALA traded 65.1% below its ATH at $0.283. The RSI practically struggled to sustain above the half-line for the last three weeks. Now, it tested the 37-mark resistance and endeavored to surpass it. A sustained close above this level could support a likely falling wedge breakout. However, the CMF displayed weak signals after a steep plunge. It exhibited a bearish edge after flashing low money volumes.


