Ethereum Classic broke out of a long-term downtrend; here’s where you can buy in

Disclaimer: The findings of the following analysis are the sole opinions of the writer and should not be considered investment advice
In the near term, Ethereum Classic had a bullish bias. It flipped a former area of supply at $31 into an area of demand and repeatedly tested the $33.5-resistance level over the past week. Moreover, a trendline resistance from November was also broken over the past week.
Although the trend was not bullish at the time of writing, it could be the beginning of a reversal that could climb as high as $38.
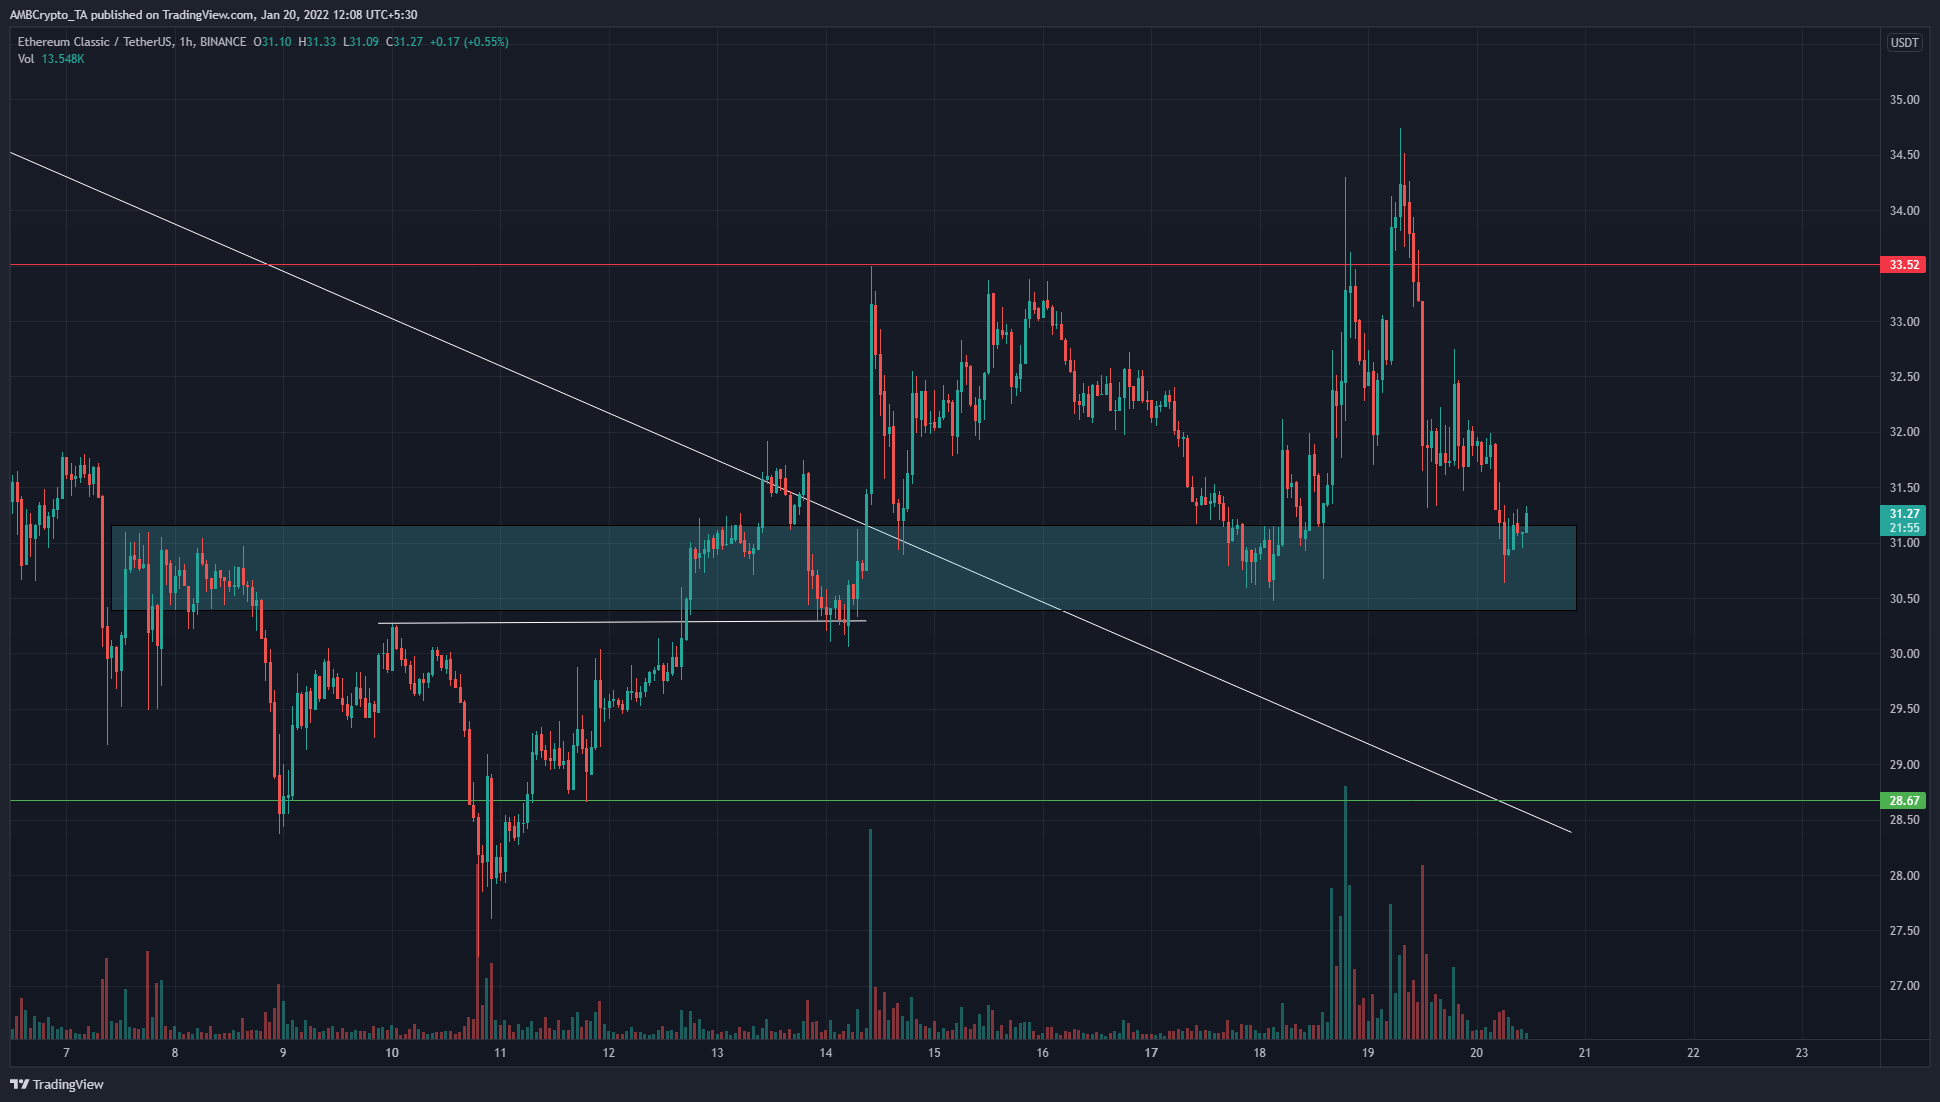
The trendline resistance (white) extended back to early November and has rejected the price multiple times since then. In mid-January, this resistance level was tested and the price dipped back to $30.3 to confirm the market structure break from bearish to bullish. Subsequently, ETC rose towards $33.52 but was rejected, and appeared to form a range.
This was the kind of sideways trading that shifts control from one side to another. After a strong trend, the price tends to trade within a range in an accumulation (or distribution) phase before its next move.
For a bullish move, ETC would need to flip $33.5 from resistance to support. Until then, the $30.5 and $33.5 areas can be used to buy and sell ETC at, as the past week’s price action resembled a range.
Rationale
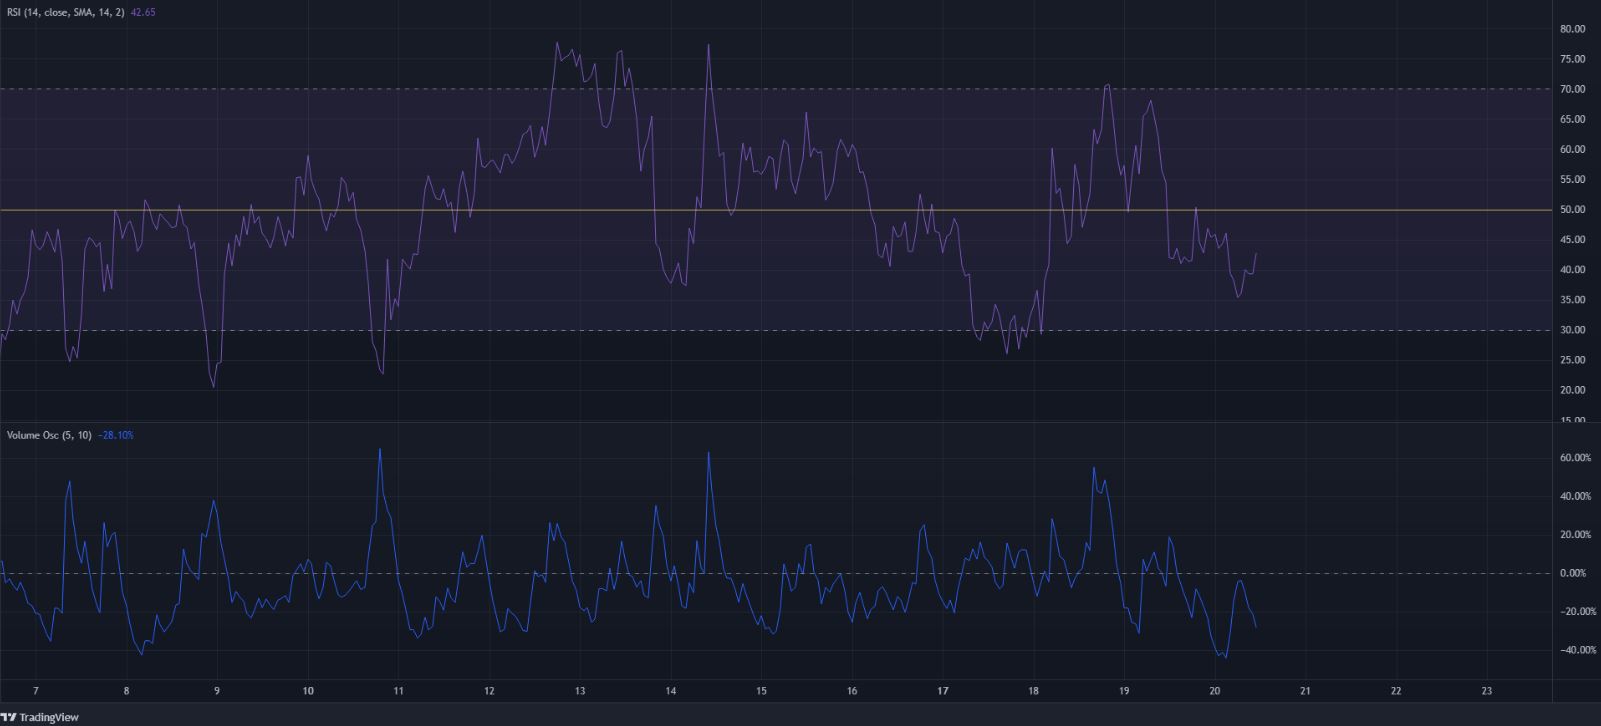
The RSI was well above neutral 50 on the two occasions that ETC ran from $30.5 to $33.5 over the past week. At the time of writing, it had hit 35 and was climbing back above 40.
Alongside the RSI, the Volume Oscillator also rose considerably on ETC’s run upwards. This showed that volume was indeed present behind ETC’s attempts to climb towards and above the $33.5-level.
In the next few hours, if the RSI can climb back above neutral 50 on the hourly chart and the Volume Oscillator could also see an uptick, it would be a bullish sign.
Conclusion
Ethereum Classic was trading in an area where buying ETC represented a good risk-to-reward trade. There was some liquidity to be found at the $30.5 area, which ETC already tested a few hours before press time.
This could be followed by another strong move north for ETC, with a price target of $33.5.


