XRP, Polkadot, Dogecoin Price Analysis: 28 May

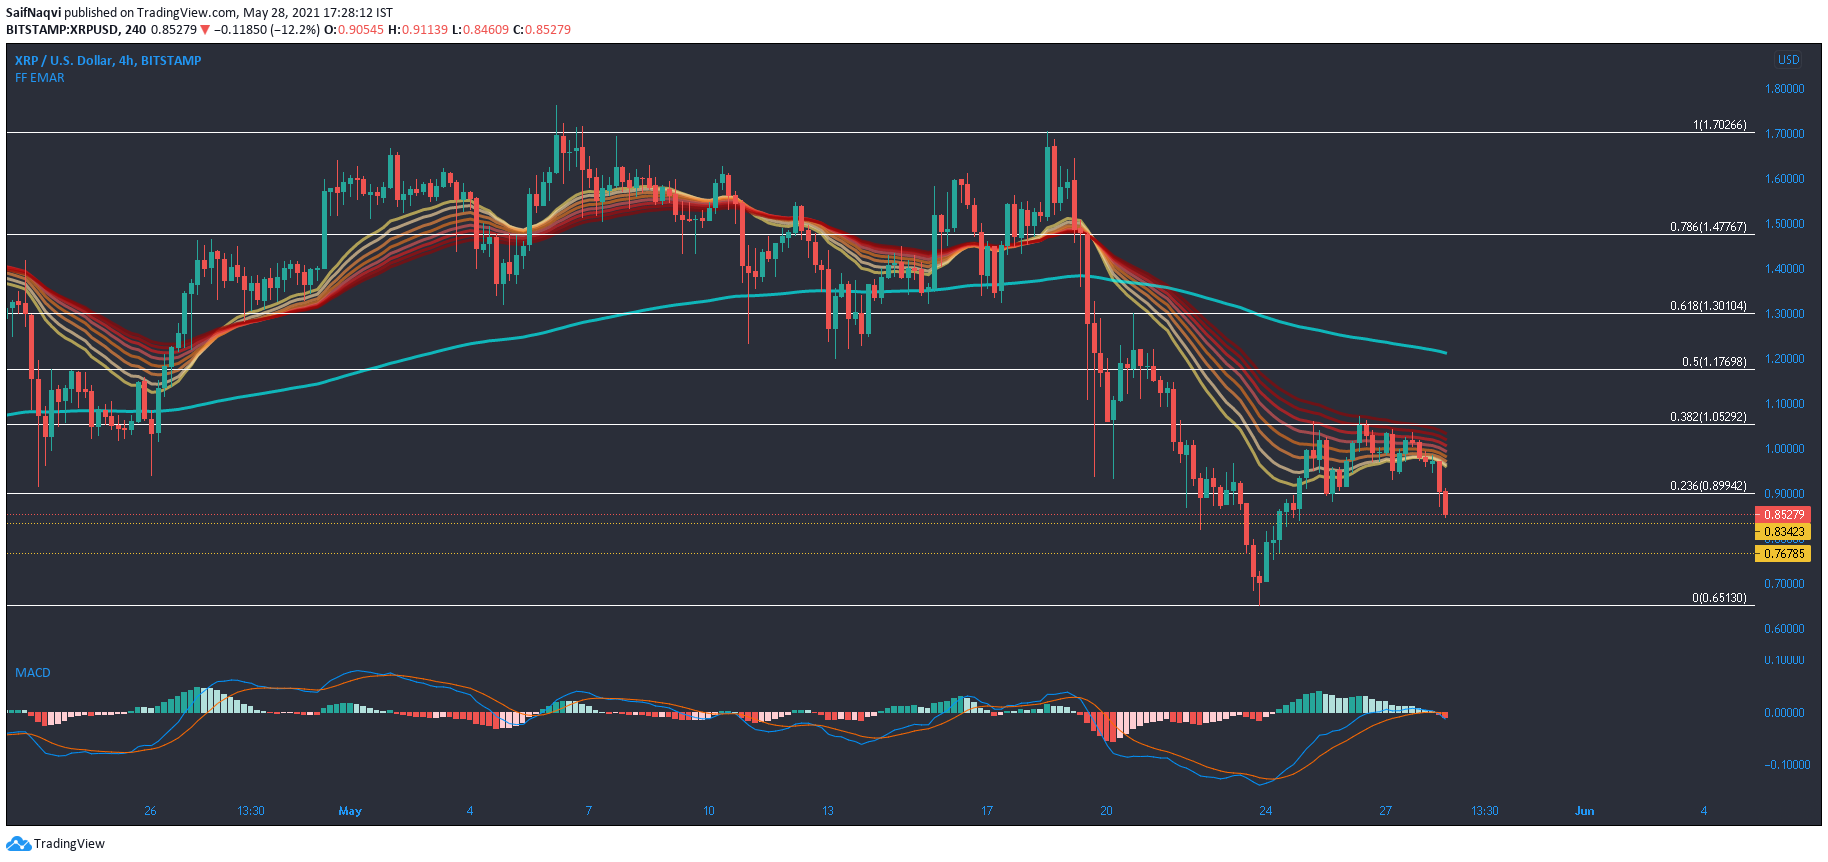
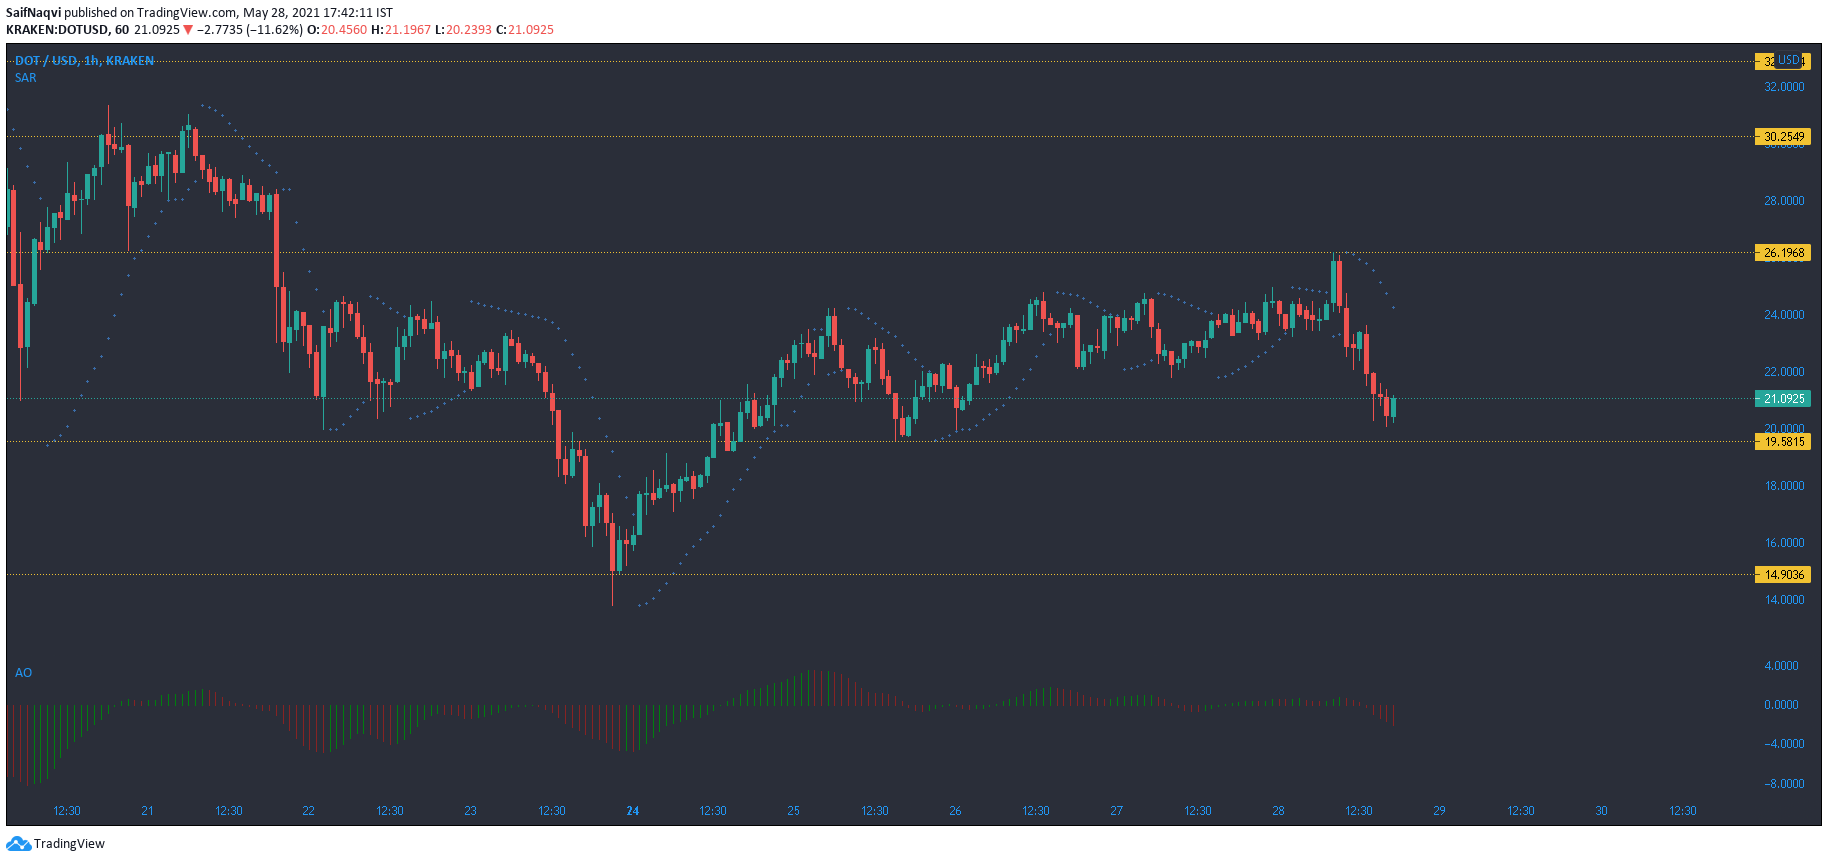
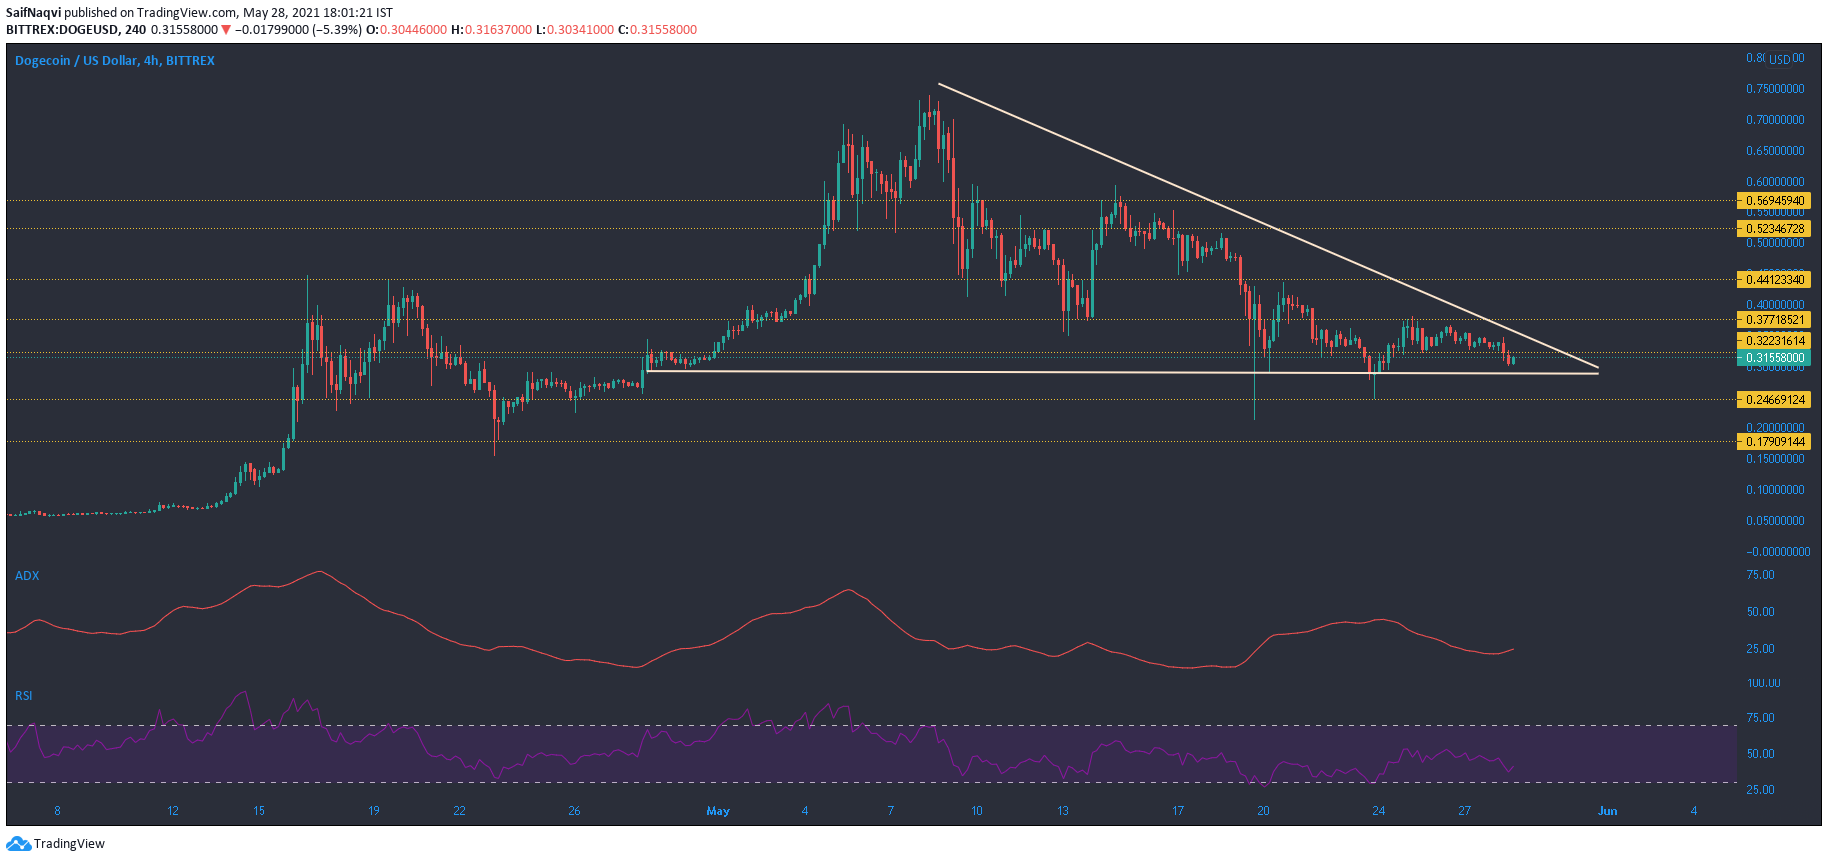
XRP was in danger of falling back towards $0.65 after conceding the 23.6% Fibonacci level ($0.899) to the bears. Polkadot could present buying opportunities at $14.9, and even at the discounted price of $10.8. Finally, Dogecoin geared up for a 35% correction in value following the formation of a descending triangle.
XRP

Source: XRP/USD, TradingView
A look at XRP’s 4-hour chart suggested that bulls have struggled to break above the 38.2% Fibonacci level ($1.05) over the past few days. This, coupled with bearish signals from the broader market, led to another breakdown as XRP moved south, at the time of writing. Few areas of support lay between its descent from $1.05 to $0.65, but none were established as reliable buy zones just yet. If these levels do hold up, expect a bounceback from $0.83-$0.76.
Interestingly, the EMA Ribbons also moved between $0.968 to $1.05, making this region a crucial zone to reclaim. In case of a breakout, a 15% hike awaited XRP from $1.05 to $1.21 and the 200-SMA (light blue). The MACD indicator flashed a bearish crossover and headed back below equilibrium – signaling bear market conditions.
Polkadot [DOT]

Source: DOT/USD, TradingView
The hourly timeframe for Polkadot highlighted a sell-off as the cryptocurrency shed 15% of its value over the last 24 hours. The Awesome Oscillator noted selling pressure after it formed a series of red bars below the half-line. The Parabolic SAR’s dotted markers also moved below the candlesticks and presented a sell signal for DOT. These dots would switch to ‘buy’ in case of a break above $26.2, but such an outcome seemed unlikely over the coming sessions.
The support marks rested at $14.9 and $10.8, in case of sharper losses, but the broader market sentiment would likely drive DOT moving forward.
Dogecoin [DOGE]

Source: DOGE/USD, TradingView
The formation of a descending triangle on the 4-hour chart presented a threatening situation in the Dogecoin market. Since reaching record levels prior to the SNL saga, DOGE has formed steadily formed lower highs, while failing to reclaim key zones even in a bullish broader market. The lower zone between $0.29-0.27 represented the cut-off point for the bulls. Any move below this could result in a breakdown from the pattern, one which could trigger a 35% spiral towards its mid-April levels of $0.179.
On the flip side, a hike above $0.377 would negate the pattern and allow for more bullish price action. The ADX indicator moved north from 25 as a strong trend lay present for another price swing. The RSI was slightly in bearish territory and chances of a bullish move were slim moving forward.


