XRP Price Analysis: 11 April

The XRP market has hit a level unseen since 2018. The digital asset has finally surpassed $1 and has been trading at $1.41, at the time of writing. Although its market capitalization has reduced to $45.40 billion, XRP has received a strong boost among the top ten cryptos as it gained a fourth place on the CoinMarketCap list.
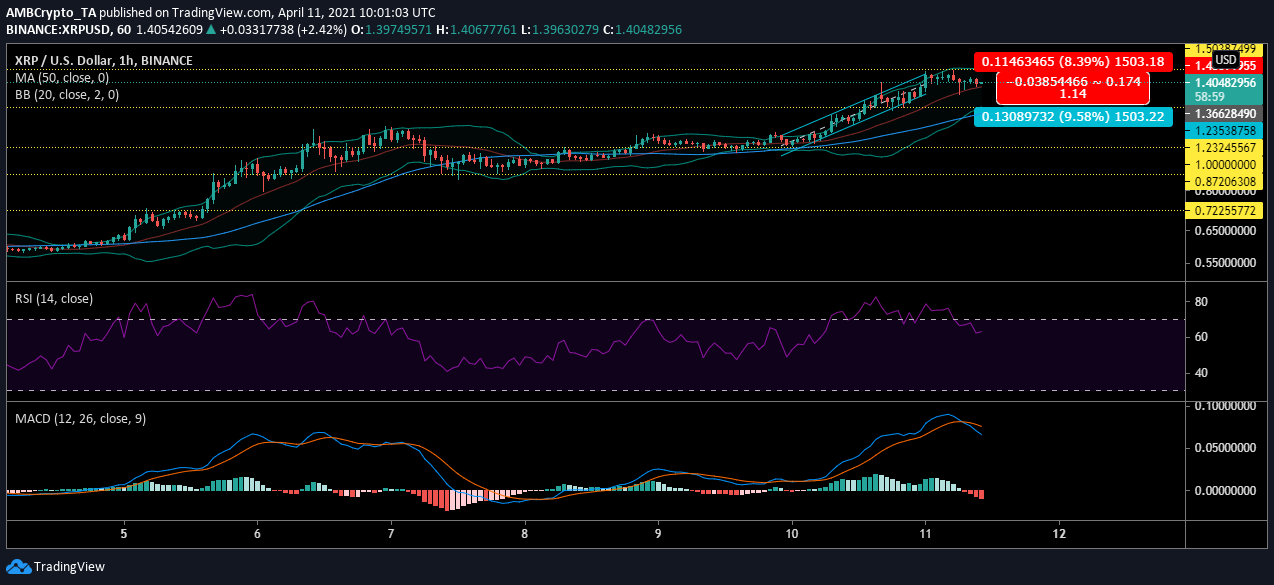
XRP 1-hour chart

Source: XRPUSD on TradingView
The XRP chart above was indicating that after the price surpassed $1, it witnessed further bullish momentum. The price was climbing higher within an ascending channel, but as it hit the resistance at $1.50 the price retraced.
It could be seen that the price broke out of the ascending channel and began consolidating at $1.37. This sudden surge hints at a possible correction setting in as the coin moves forward.
Reasoning
The sudden boost in price followed the courtroom drama between Ripple and the U.S. Securities and Exchange Commission [SEC]. However, XRP may not be able to sustain this level as it had already begun to endure minor corrections. At the time of press, the Bollinger Bands indicated a highly volatile market.
Whereas the signal line has taken a place under the candlesticks, and a crossover could be possible as it continued to point upwards.
Meanwhile, the relative strength index had pushed the digital asset into the overbought zone but has now slipped back under this level. This suggested that as the correction sets in, the asset will move on to a more stable equilibrium zone. The MACD indicator also highlighted the bearishness that had taken over as the MACD line dropped under the signal line.
Crucial levels
Entry-level: $1.36
Take Profit: $1.23
Stop-level: $1.48
Risk to Reward: 1.14
Conclusion
The current XRP market, although high on bullish sentiment, is likely to see increased bearishness. The sudden surge may not be sustained in the market given the rise in selling pressure. As the XRP market moves forward, a correction might push the price to the support at $1.23.


