XRP Price Analysis: 19 December

Disclaimer: The findings of the following article are the sole opinion of the writer and should not be taken as investment advice
XRP’s price hasn’t really fared well since the start of December. While the world’s largest cryptocurrency Bitcoin managed to go past key resistance levels, the price of XRP continued to trade within the confines of a descending channel formation. In fact, in the past few days, it did manage to break out in the expected direction – upwards. While this hike was a welcome change, the coin still found itself 15 percent off its trading price from the start of the month.
At press time, XRP was trading at $0.569 with a market cap of $25.8 billion. According to CoinMarketCap, XRP was registering a 24-hour trading volume of over $13 billion, having recorded a minor dip of over 3 percent in 24-hours.
XRP 4-hour chart
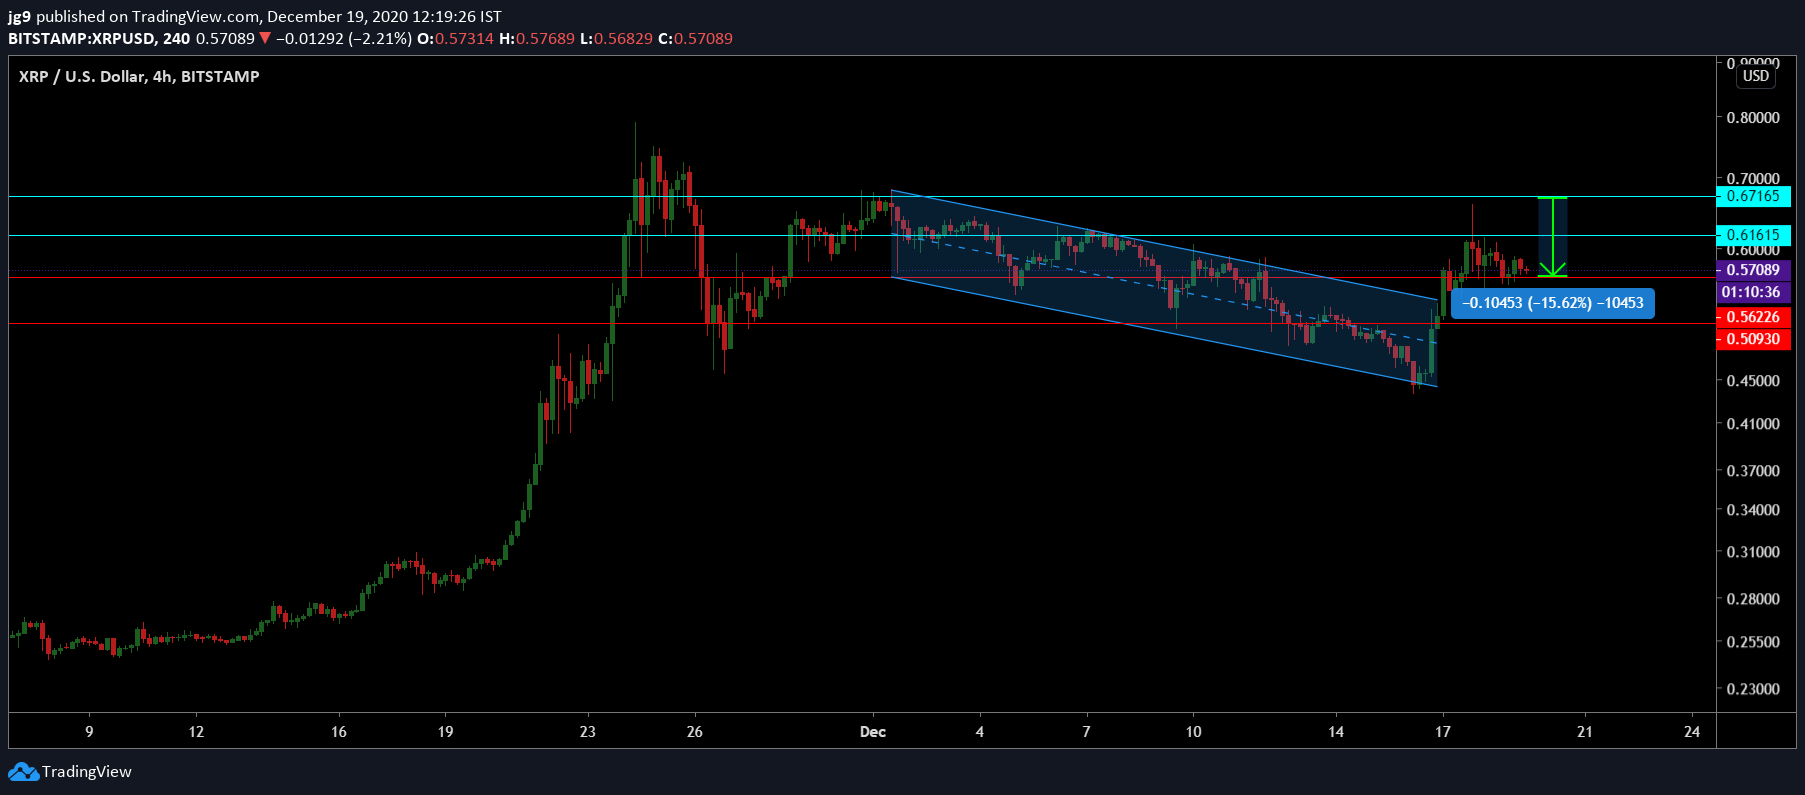
Taking a look at XRP’s 4-hour chart gives one a little more clarity regarding XRP’s long-term price action since the start of the month. After breaking out of the descending channel formation that dictated its price for almost the entire month of December to date, the coin, despite its upward breakout, found itself enduring a wave of sideways movement. This made it a bit difficult to determine what position a trader should take with respect to XRP, at the time of writing.
At press time, the coin was testing the support at $0.562, and if this support fails, the coin may drop towards the $0.509-price range. However, if the bulls can carry the weight of XRP, then it may soon encounter resistance at two key levels – $0.61 and $0.67.
Reasoning
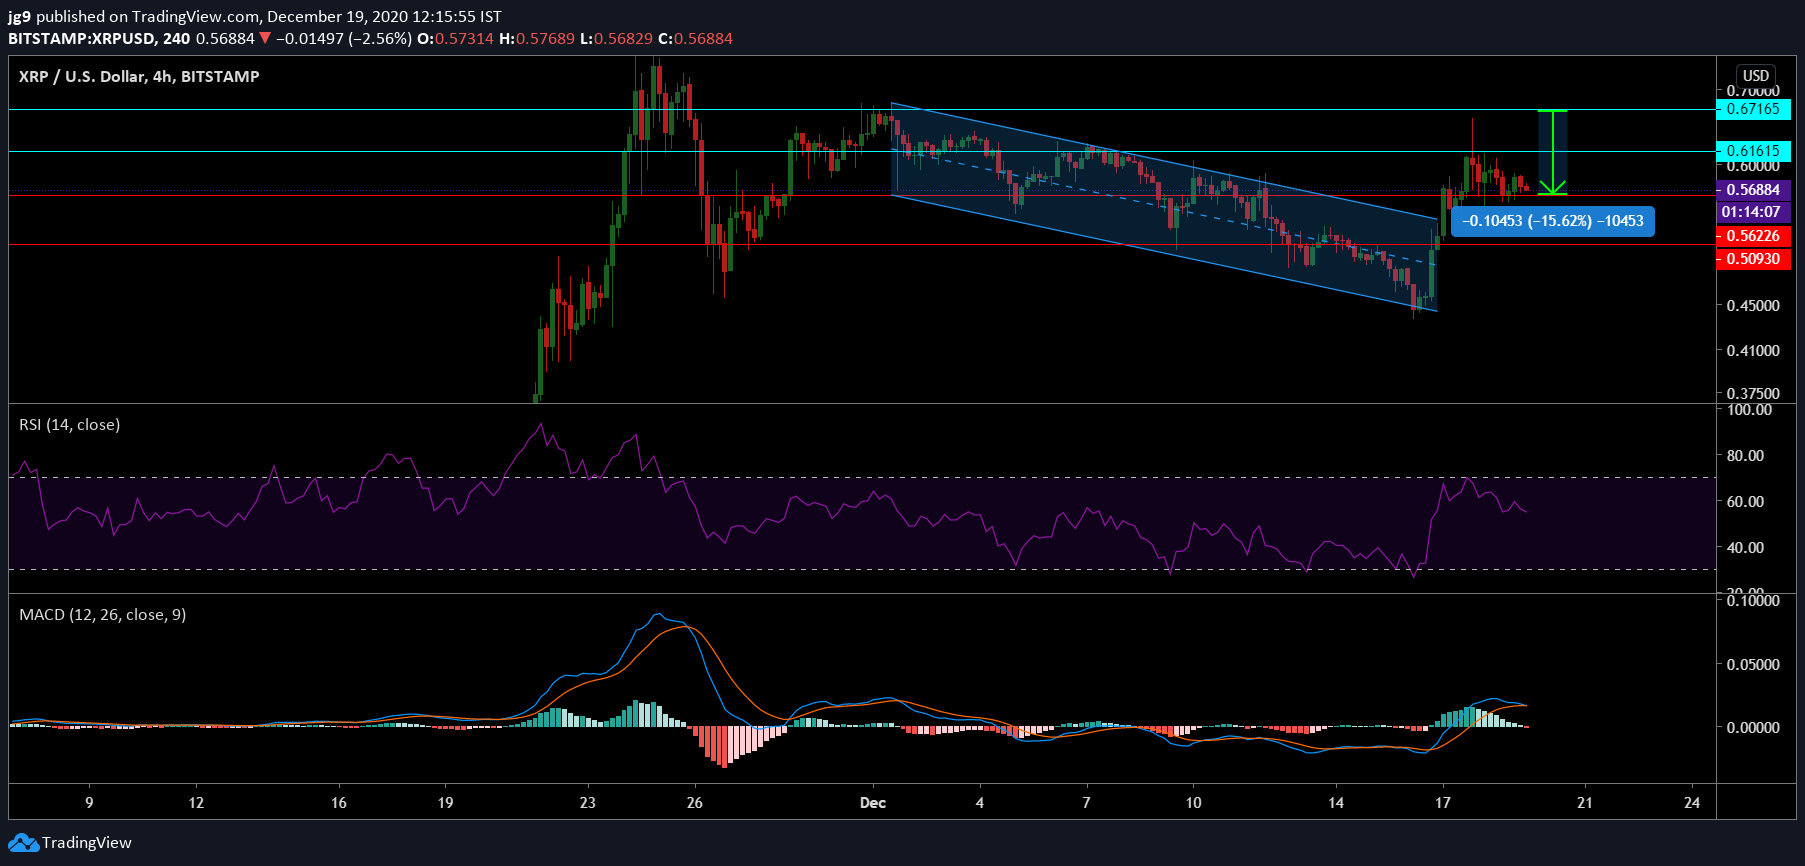
XRP seemed to be undergoing a minor trend reversal. The RSI indicator, after having spent time at the overbought zone, was heading into the neutral zone. A similar scenario was seen in the case of the MACD indicator as well, with the Signal line on the verge of going past the MACD line. The indecisiveness of the indicators can also be taken as a sign of a consolidatory phase opening up for XRP.
Conclusion
While XRP’s price seemed to have broken out of the steady downtrend it was on since the start of the month and after having seen brief bullish momentum help its trading price, it looked like the coin was settling into a short phase filled with sideways movement. This seemed likely to result in XRP trading between its immediate support and resistance levels in the coming week.