XRP, Shiba Inu, Tezos Price Analysis: 25 April

With market leaders, Bitcoin and Ethereum, falling below key price points, the global crypto market cap witnessed a corresponding 24-hour plunge. Thus, XRP, Shiba Inu and Tezos projected a near-term bearish outlook while their 4-hour RSIs headed into the oversold part.
XRP
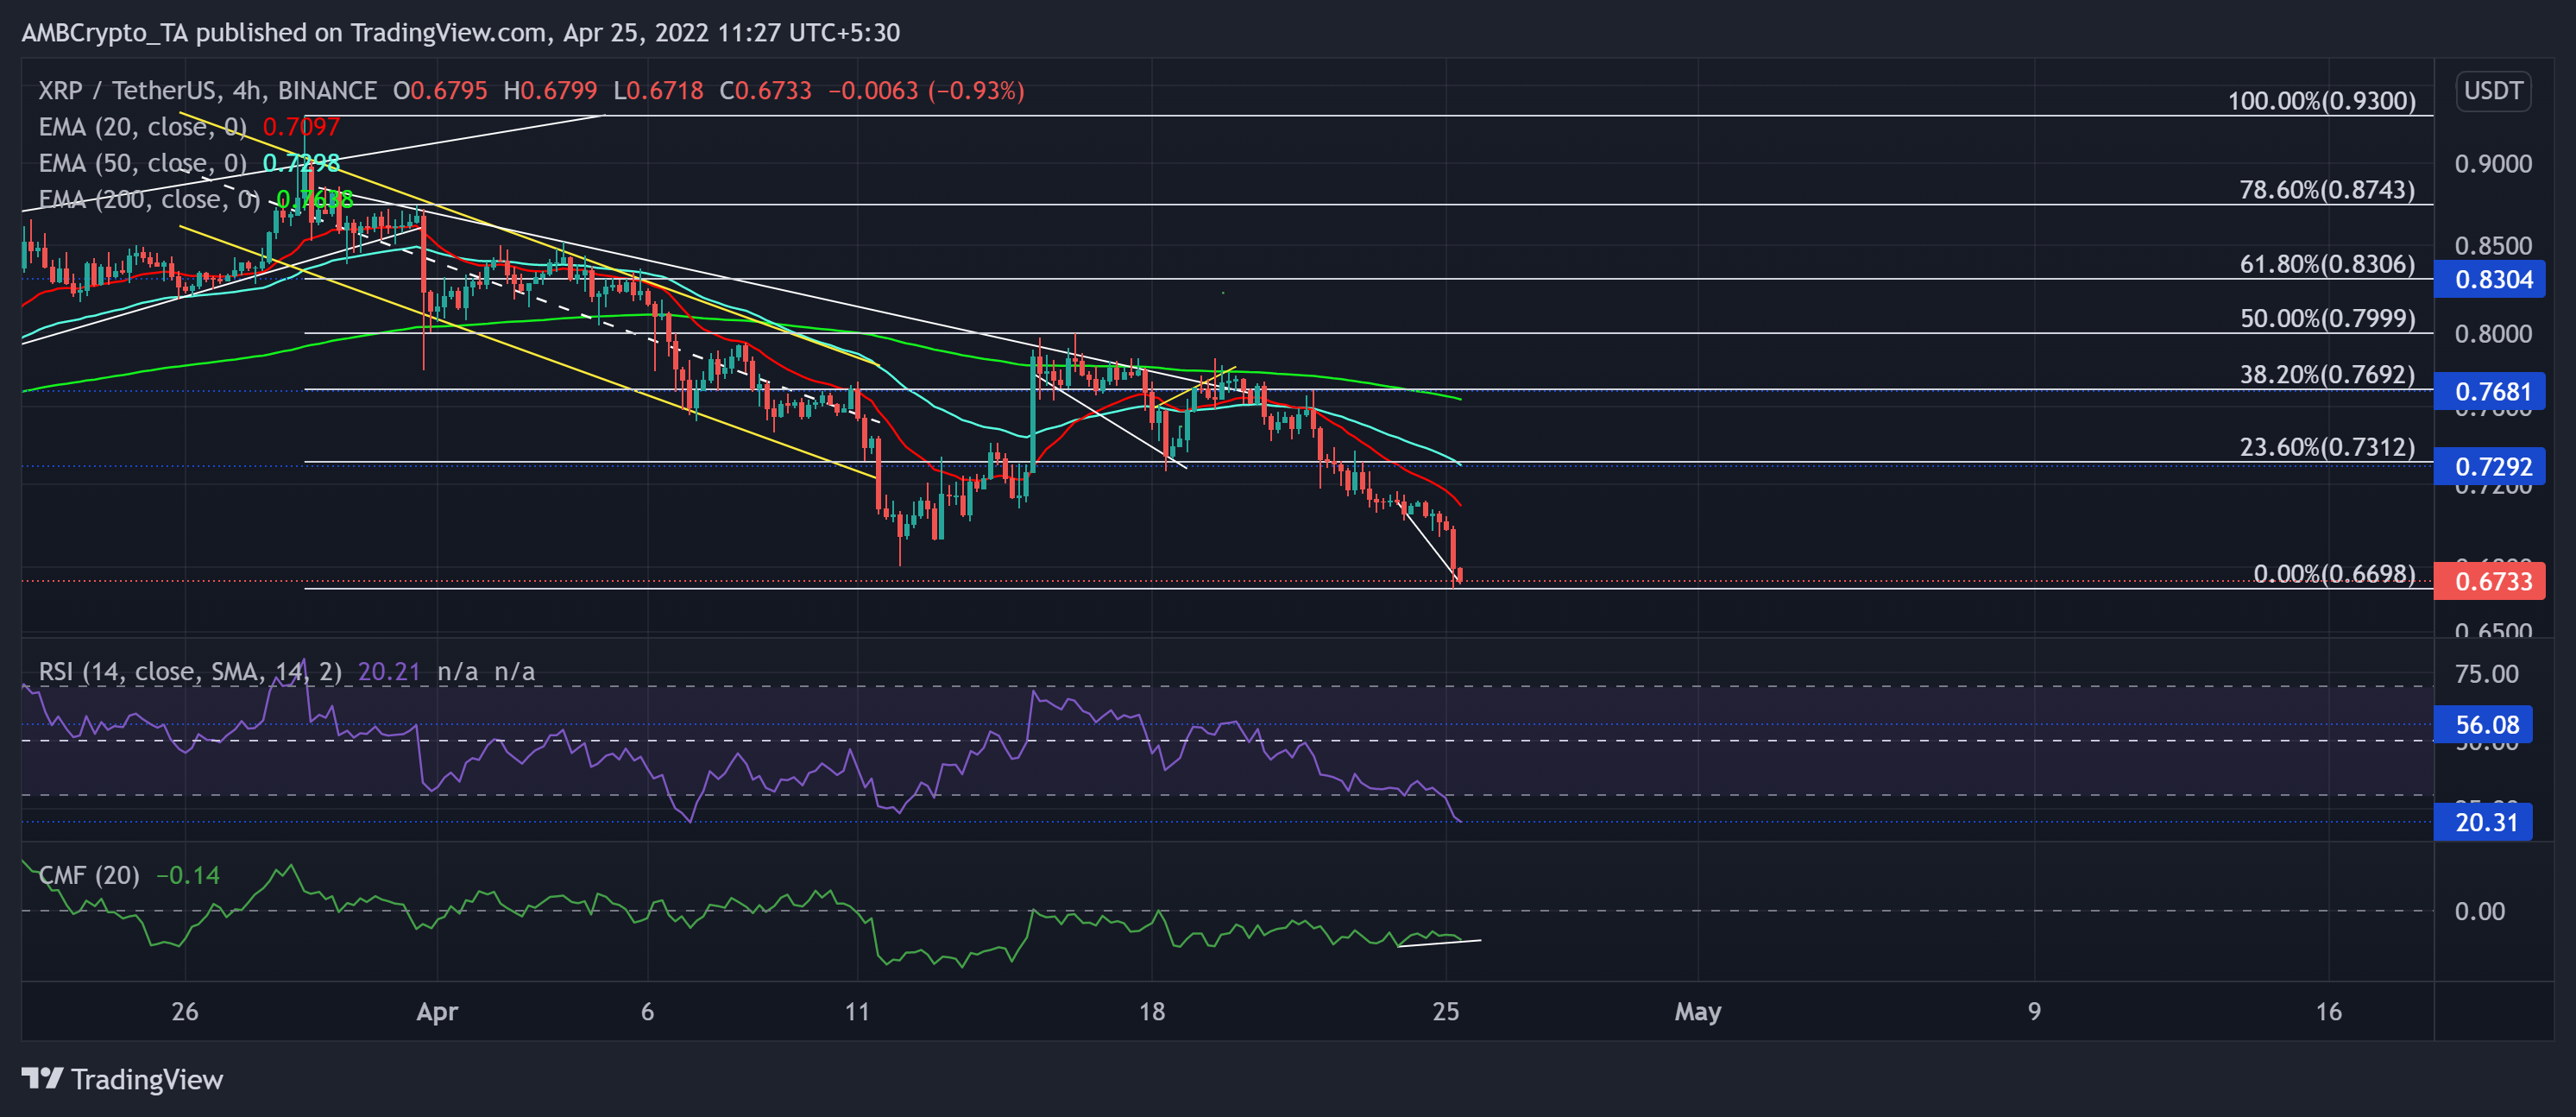
Despite the buyers attempting to counter the recent sell-offs, the bears have swooped in to push prices to deeper lows.
The descent initiated at the 38.2% Fibonacci resistance propelled a 12.24% plummet in just three days. Thus, after falling below its 20/50/200 EMA, XRP plunged to touch its one-month low on 25 April. From here on, the $0.7 zone would likely shun immediate recovery endeavors.
At press time, XRP traded at $0.6733. The Relative Strength Index took a significant drop toward the 20-mark base while heading right into the oversold region. A revival from this mark is plausible in the coming times. Also, the CMF undertook a bullish divergence with price over the last day. Thus, a near-term retrieval might be lurking around the corner.
Shiba Inu (SHIB)

Kindly note that SHIB price is multiplied by 1000, for brevity.
On its upswing after breaking out of its previous falling wedge (yellow), SHIB buyers endeavored to drift the viewpoint in their favor, but the bears upheld the two-month trendline resistance (white, dashed).
Over the last 12 days, the meme token saw an over 23% loss that seems to slow down at the lower trendline of the falling wedge (white). As a result, SHIB fell below its 20 EMA (red) while it steeply looked south.
At press time, SHIB traded at $0.02314. Over the last few days, the RSI hovered in the oversold territory and highlighted a seller’s market. Further, with the diverging upper and lower band of Bollinger Bands (BB), SHIB broke into high volatility whilst supporting a bearish narrative.
Tezos (XTZ)

XTZ saw an over 28.47% retracement as it fell in a descending channel (yellow) and matched its mid-March lows at the $2.8 base. Consequently, it broke out of the pattern but failed to sustain a position above its EMA ribbons.
With a falling wedge (white) setup on the 4-hour timeframe, the buyers would aim to push for more after upholding the $2.8 support.
At press time, the alt traded at $2.851. Over the last day, the RSI floated at the brink of the oversold mark while affirming a selling vigor. A fall below this level could drive a further pullback on XTZ’s charts before any bullish comeback.