XRP, STEPN, Waves Price Analysis: 28 April

Bitcoin bounced from the $38k level in the past couple of days, and this saw some altcoins bounce as well. However, for many of them, the downtrend remains unbroken. XRP and Waves are prime examples as their market structure remained bearish. STEPN, on the other hand, was pushing higher on the back of strong demand.
XRP
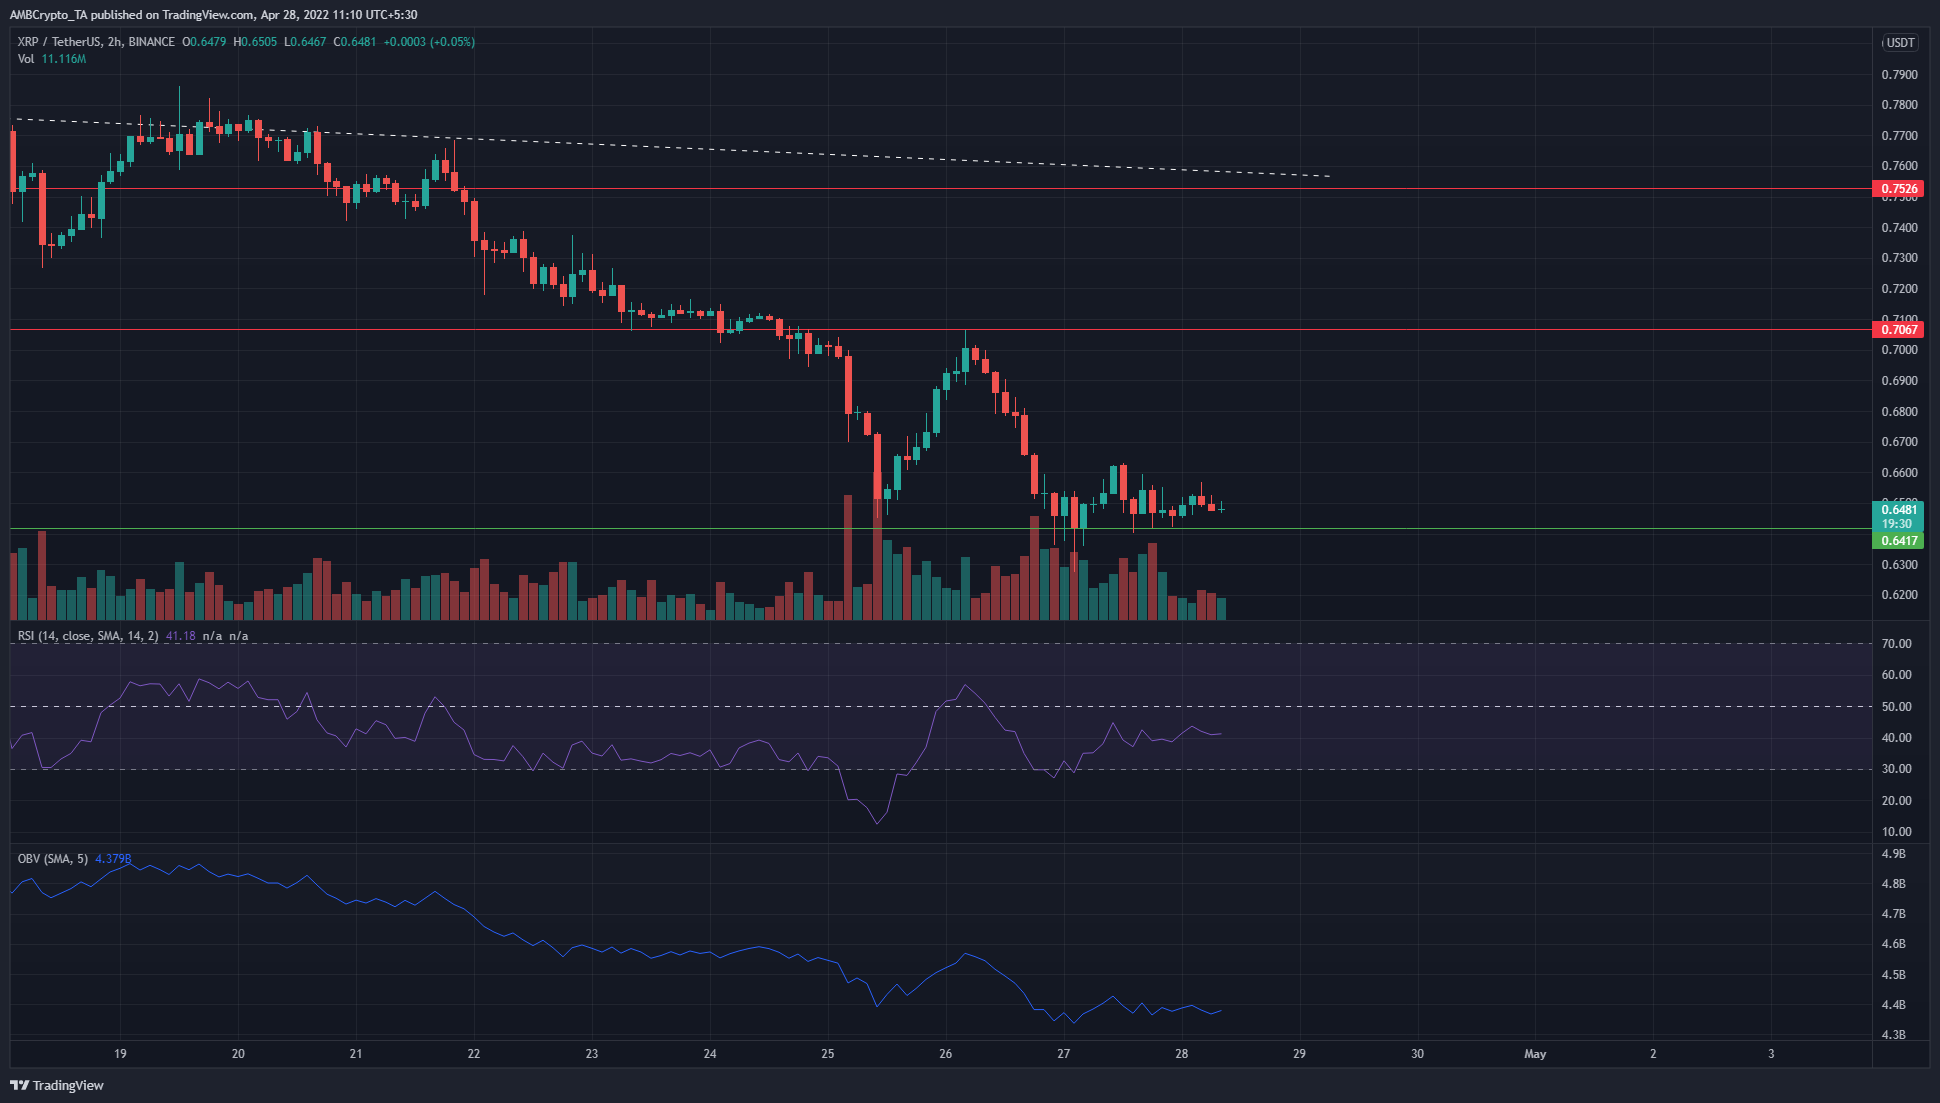
XRP has retested the $0.7 level as resistance, and for the bulls, $0.7 remains the level to beat in order to bring about a near-term bullish structure. Apart from the $0.7 resistance, the price has slipped beneath the mid-point (dotted white) of a long-term descending channel. This meant that XRP was likely to plunge further in the coming days/weeks, towards the channel lows at $0.51.
The RSI has been recovering toward neutral 50, and a hidden bearish divergence could develop in the next few hours. Such a development would signal a continuation of the former trend, in this case, a downtrend. The OBV has also been climbing lower, to show selling volume has far outweighed buying volume in the past week.
STEPN (GMT)
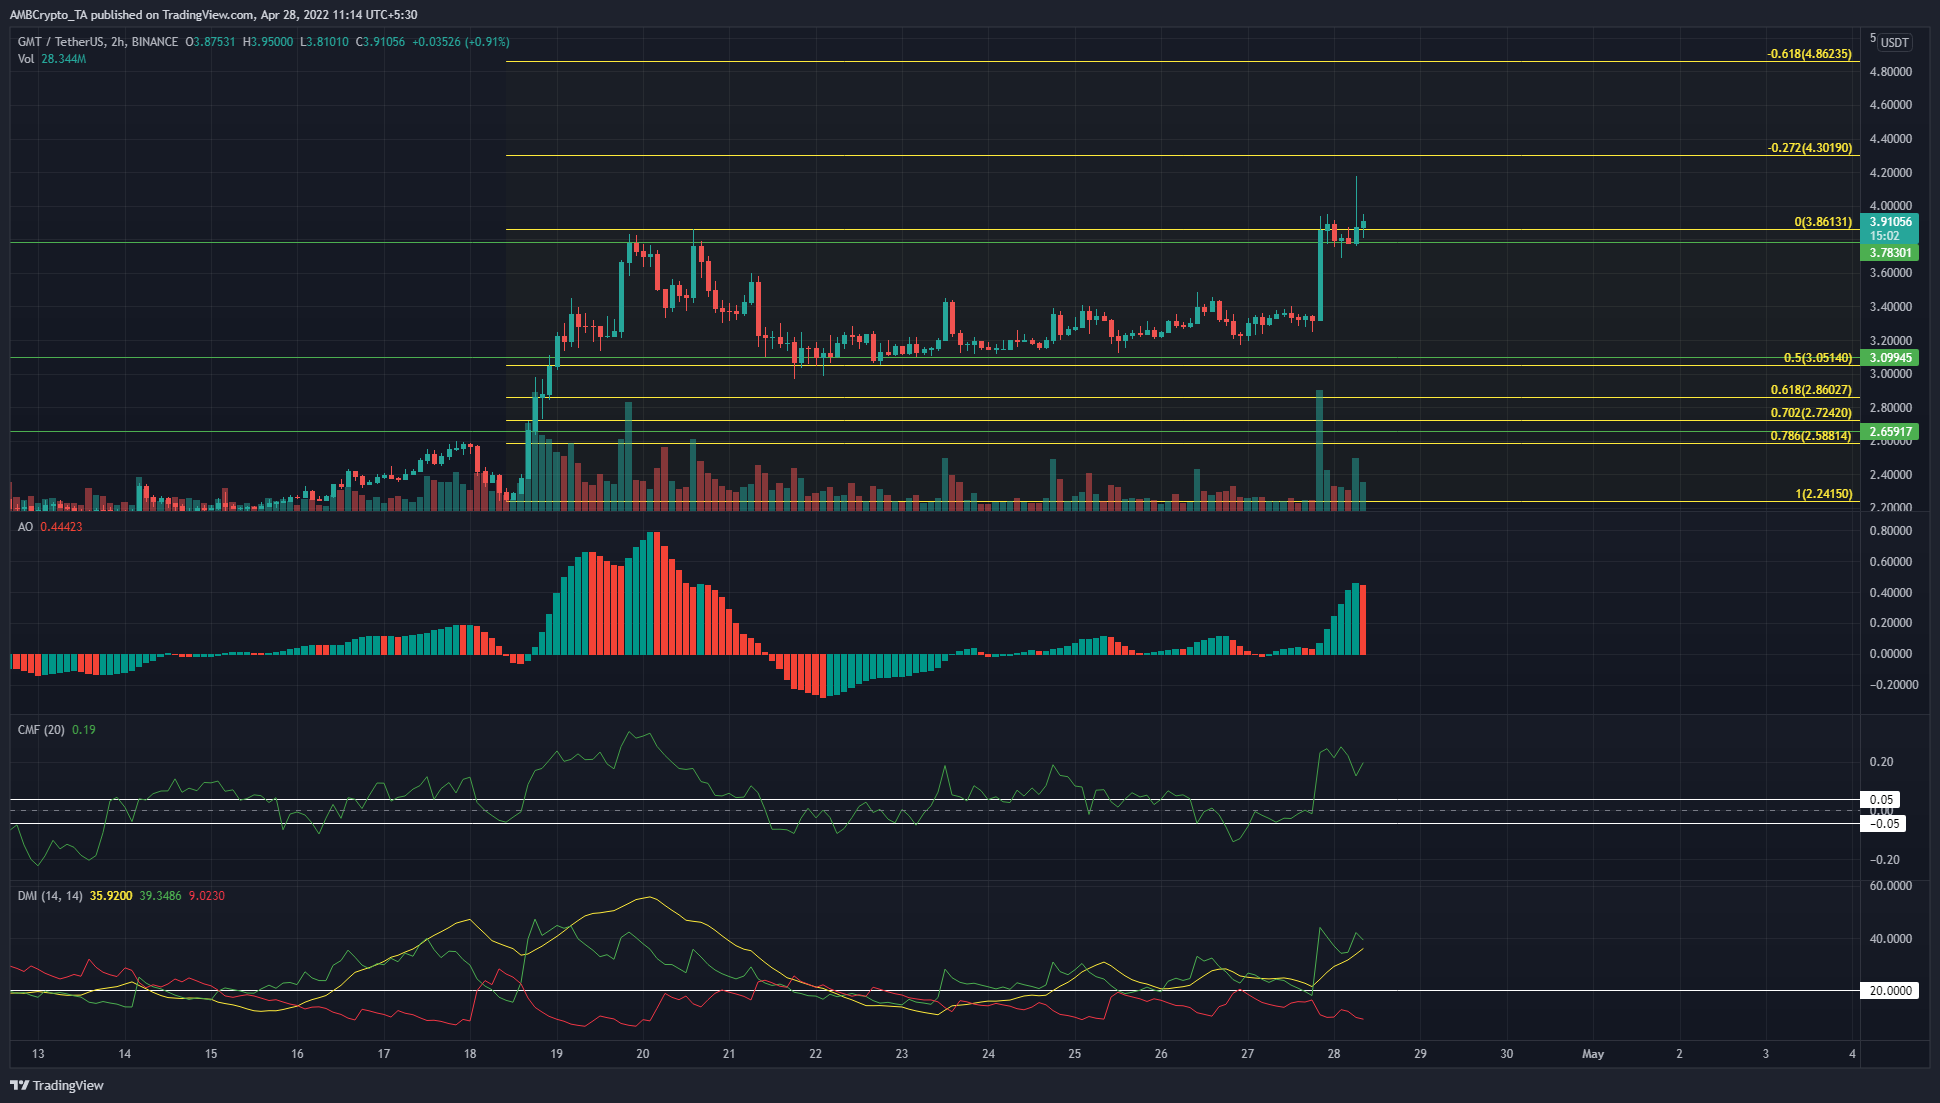
GMT has been on a strong uptrend since late March when it burst past the $0.86 resistance and hasn’t looked back since. Using Fibonacci extension levels, possible targets for bulls to take profit at are $4.3 and $4.86.
The Awesome Oscillator showed strong bullish momentum, and the CMF was also well above the +0.05 level to show strong capital flow into the market. The DMI also showed a strong uptrend in progress, with the ADX (yellow) and +DI (green) well above 20.
Waves (WAVES)
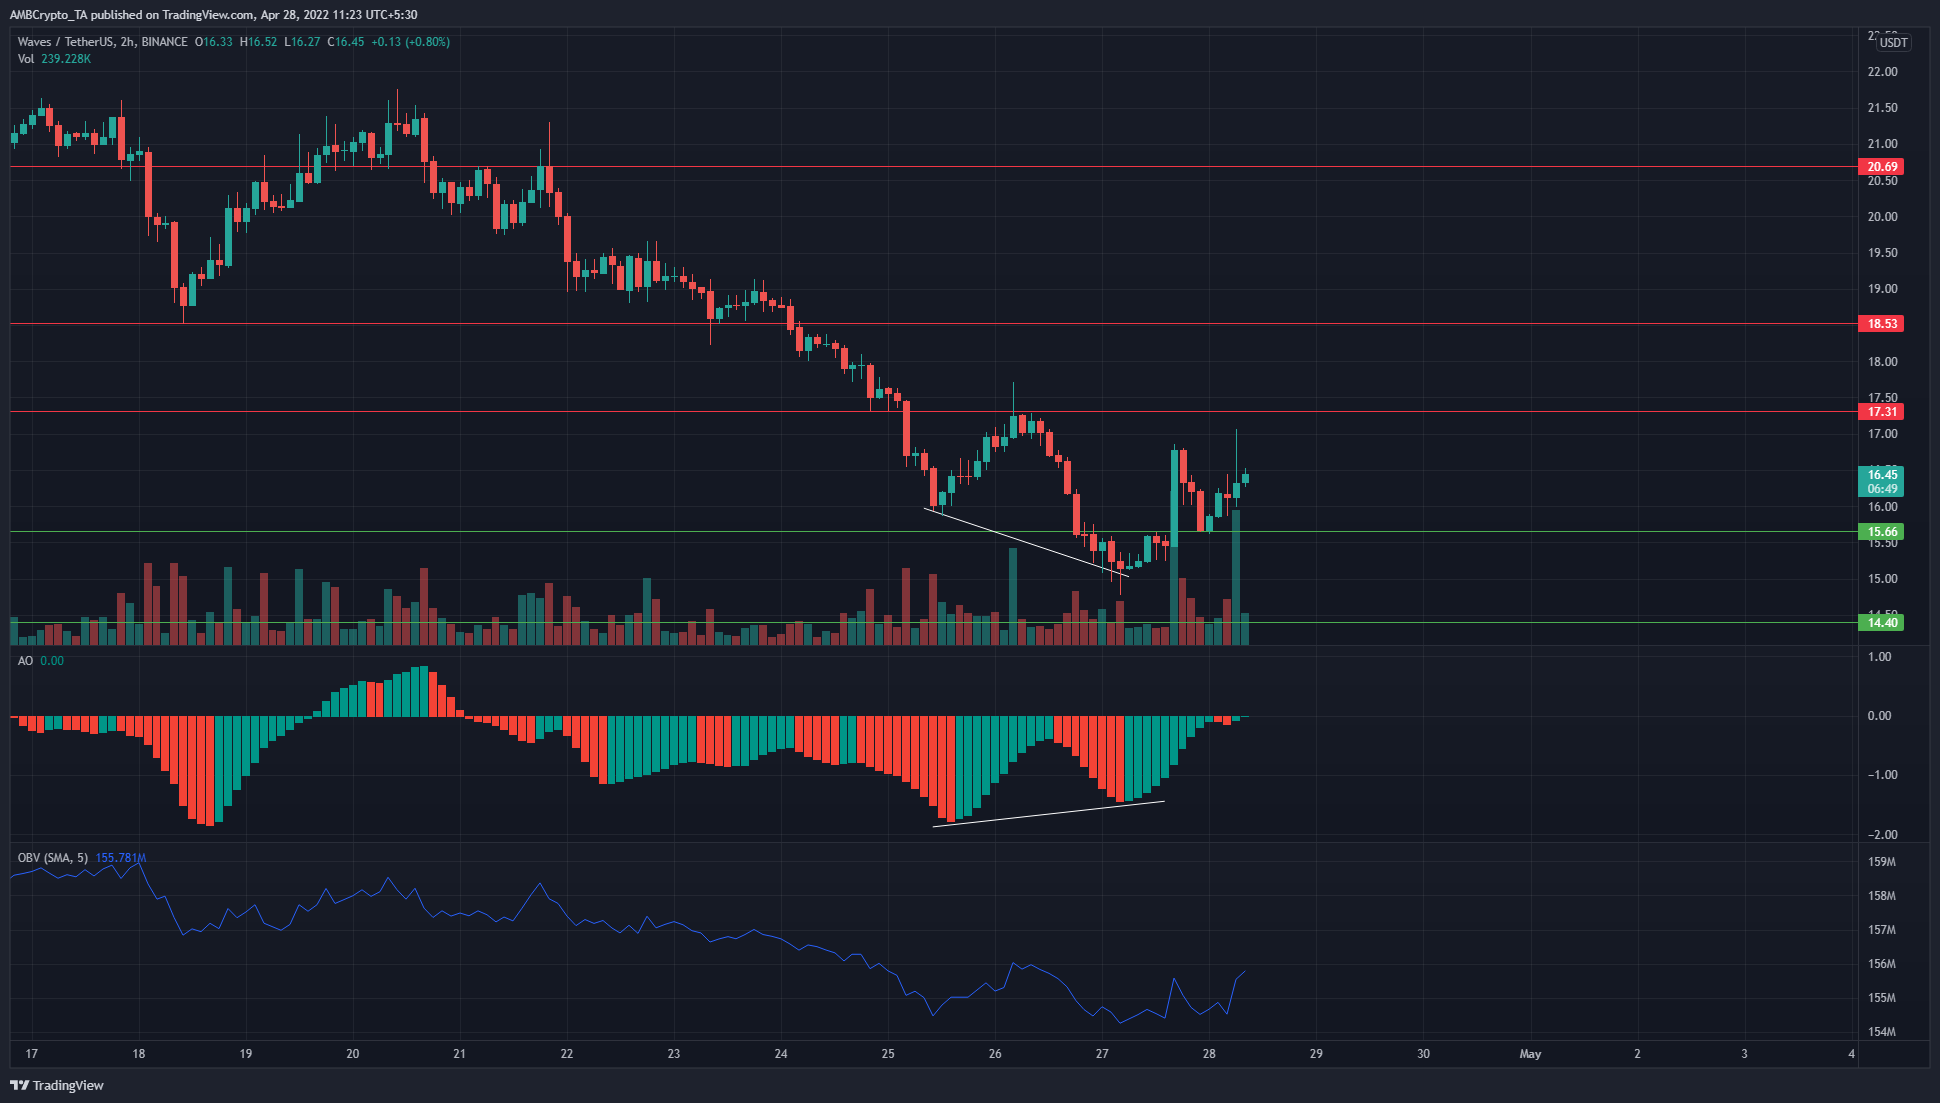
There was a bullish divergence spotted on the hourly chart, as the price made a lower low while the Awesome Oscillator made a higher low to show weakening bearish momentum. Following this development, a bounce in price was seen, and the $17.3 and $17.7 levels are likely to act as resistance.
The OBV did show a minor uptick as buyers stepped in to push prices from $15.1 to $16.5, but steady demand would be required to reverse the strong downtrend.