XRP, Synthetix, DASH Price Analysis: 24 September

As Bitcoin and Ethereum started to depreciate again on their charts, some altcoins were quick to reflect the price weakness.
XRP devalued itself as it met with a sell-off and was eyeing its immediate support level. Synthetix also lost 6.7% of its value and threatened to move near its multi-month low. Finally, DASH fell by 4.9% while trading close to its multi-month low price.
XRP
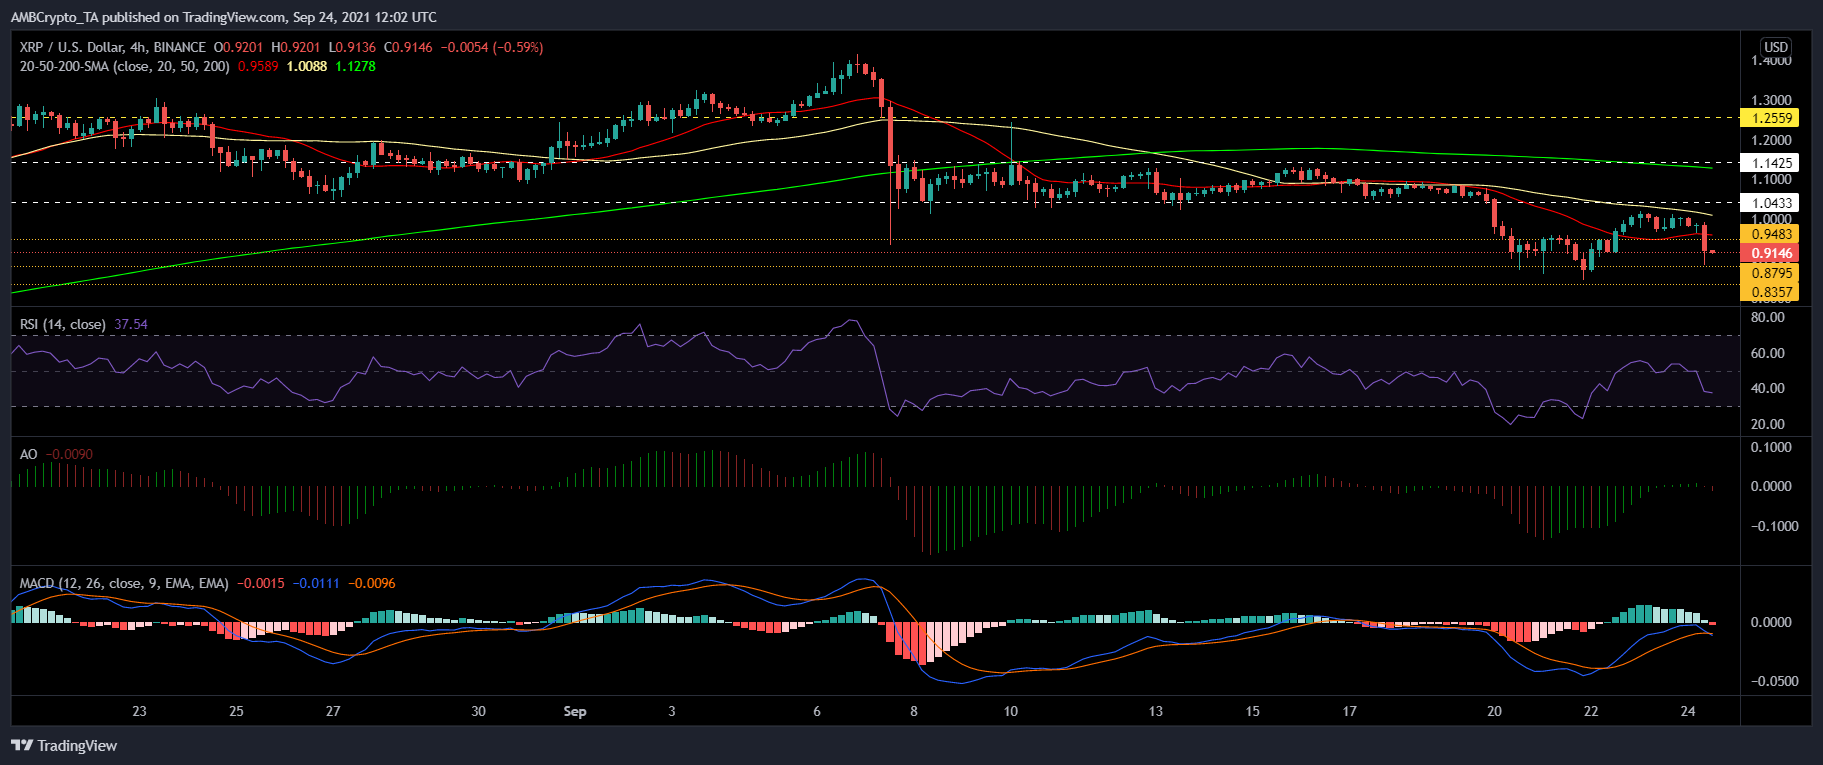
XRP lost 7.1% of its value over the last 24 hours and was trading at $0.91. At press time, it was trading above its support level of $0.87. A sustained downtrend could push the price of the altcoin to $0.83. On the four-hour chart, XRP was below the 20-SMA. This indicated that price momentum was with the sellers.
The Relative Strength Index reflected the aforementioned statement as the indicator was under the 50-mark. The Awesome Oscillator also flashed red signal bars and a sell signal. A bearish crossover was seen on the Awesome Oscillator as it pictured a red histogram.
If buying pressure returns, the price could hope to make a recovery. The immediate resistance level for XRP was at $1.04 and then at $1.14.
Synthetix [SNX]
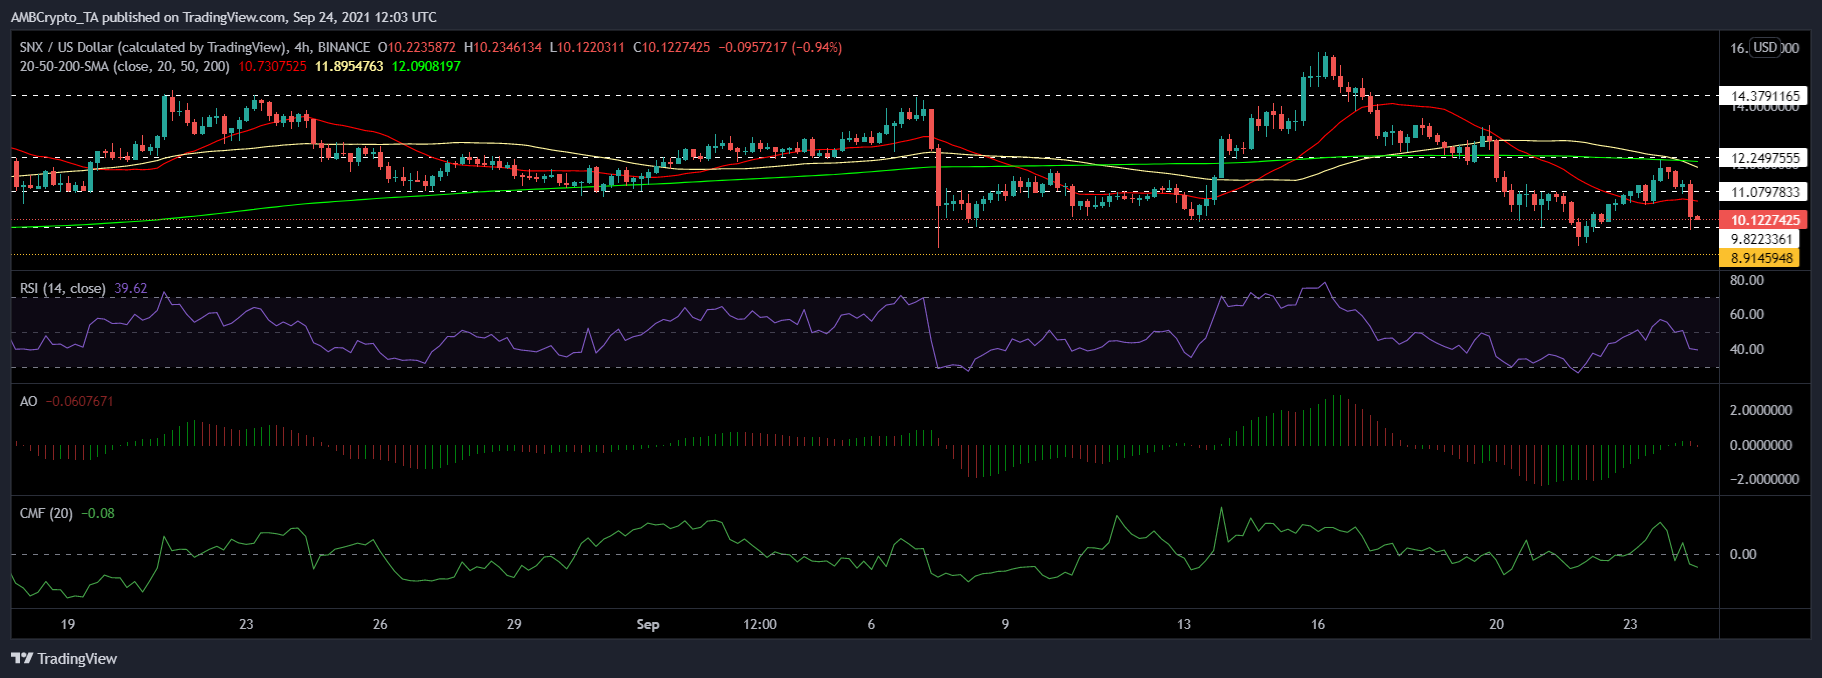
Synthetix fell by 6.7% over the last 24 hours, with the altcoin valued at $10.12. The nearest support line was at $9.82, failing to remain above which SNX could trade at a multi-month low of $8.91. Price momentum was in favor of sellers as the price of the altcoin stood above its four-hour 20-SMA line.
The Relative Strength Index was near 40, within the bearish territory. This indicated that selling pressure was more than buying pressure. The Awesome Oscillator also flashed red signal bars. Finally, the Chaikin Money Flow noted a decline in capital inflows as the indicator dropped below the half-line.
In the event of buying pressure picking itself up, Synthetix could encounter resistance first at $11.07.
DASH
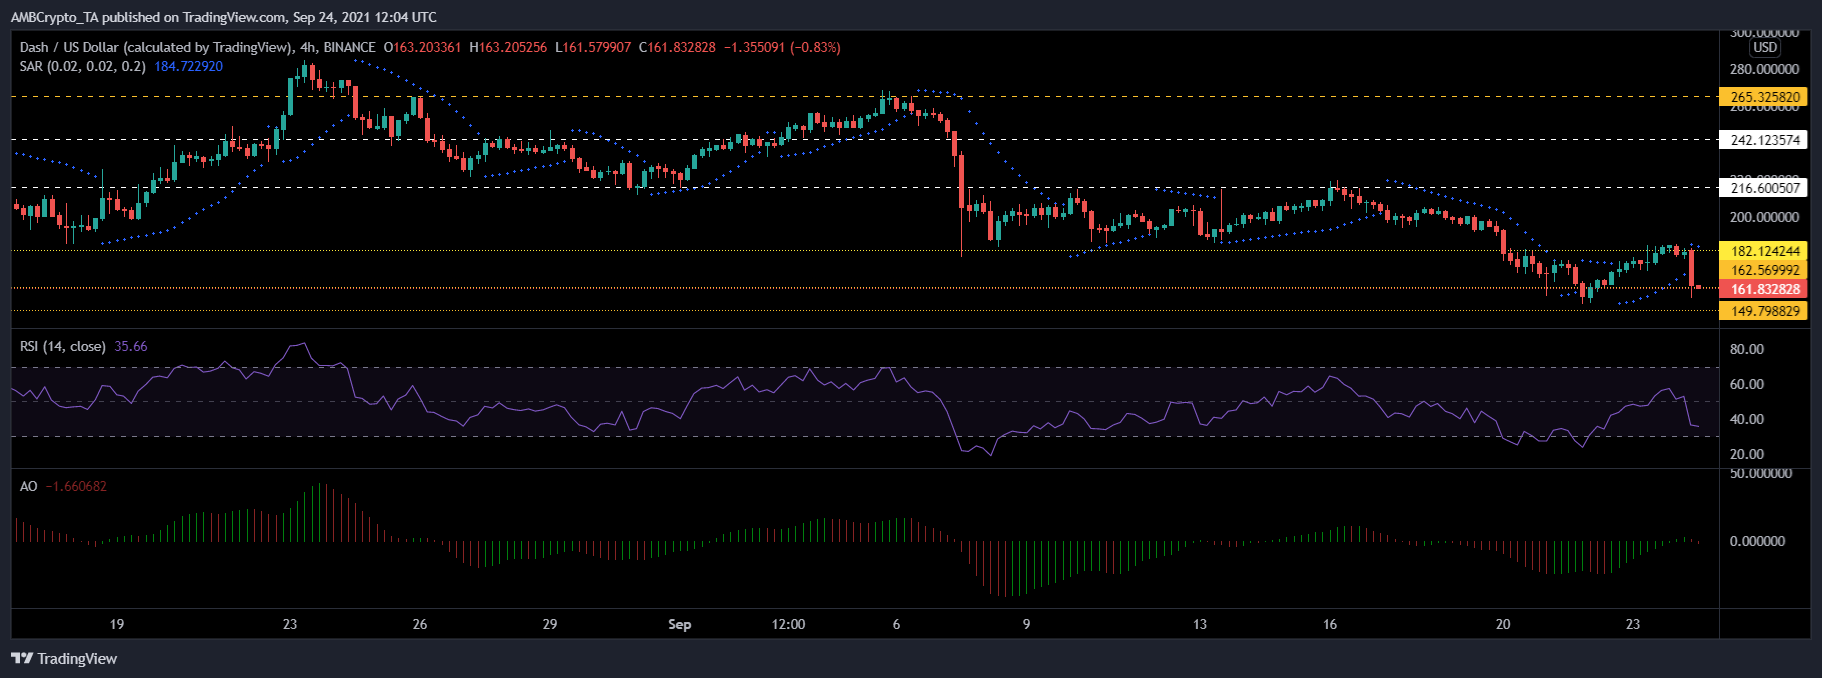
Dash dropped by 4.9% over the last 24 hours. Its support line stood at $141.79, which also is the multi-month low for the coin. Parameters for the altcoin remained bearish.
Awesome Oscillator gave off a sell signal and displayed two red signal bars after the last trading session was in the red. The Relative Strength Index was under the 40-mark, indicating bearishness as buying strength fizzled out. Parabolic SAR also flashed dotted lines above the candlesticks. This translated to a downtrend.
On the flip side, Dash could hit a price ceiling around the $182.12-level. Breaking above the same, it could revisit its one-week high of $216.60.


