XRP, Tron, Chiliz Price Analysis: 10 February

With the global crypto market cap re-entering above the $2T-zone, the gap between XRP’s EMA ribbons widened. Thus, entailing a heightened bullish vigor. But its near-term technicals gave mixed signs. Besides, Tron and Chiliz saw reversal patterns on their 4-hour charts while forming a bearish divergence with their RSIs.
XRP
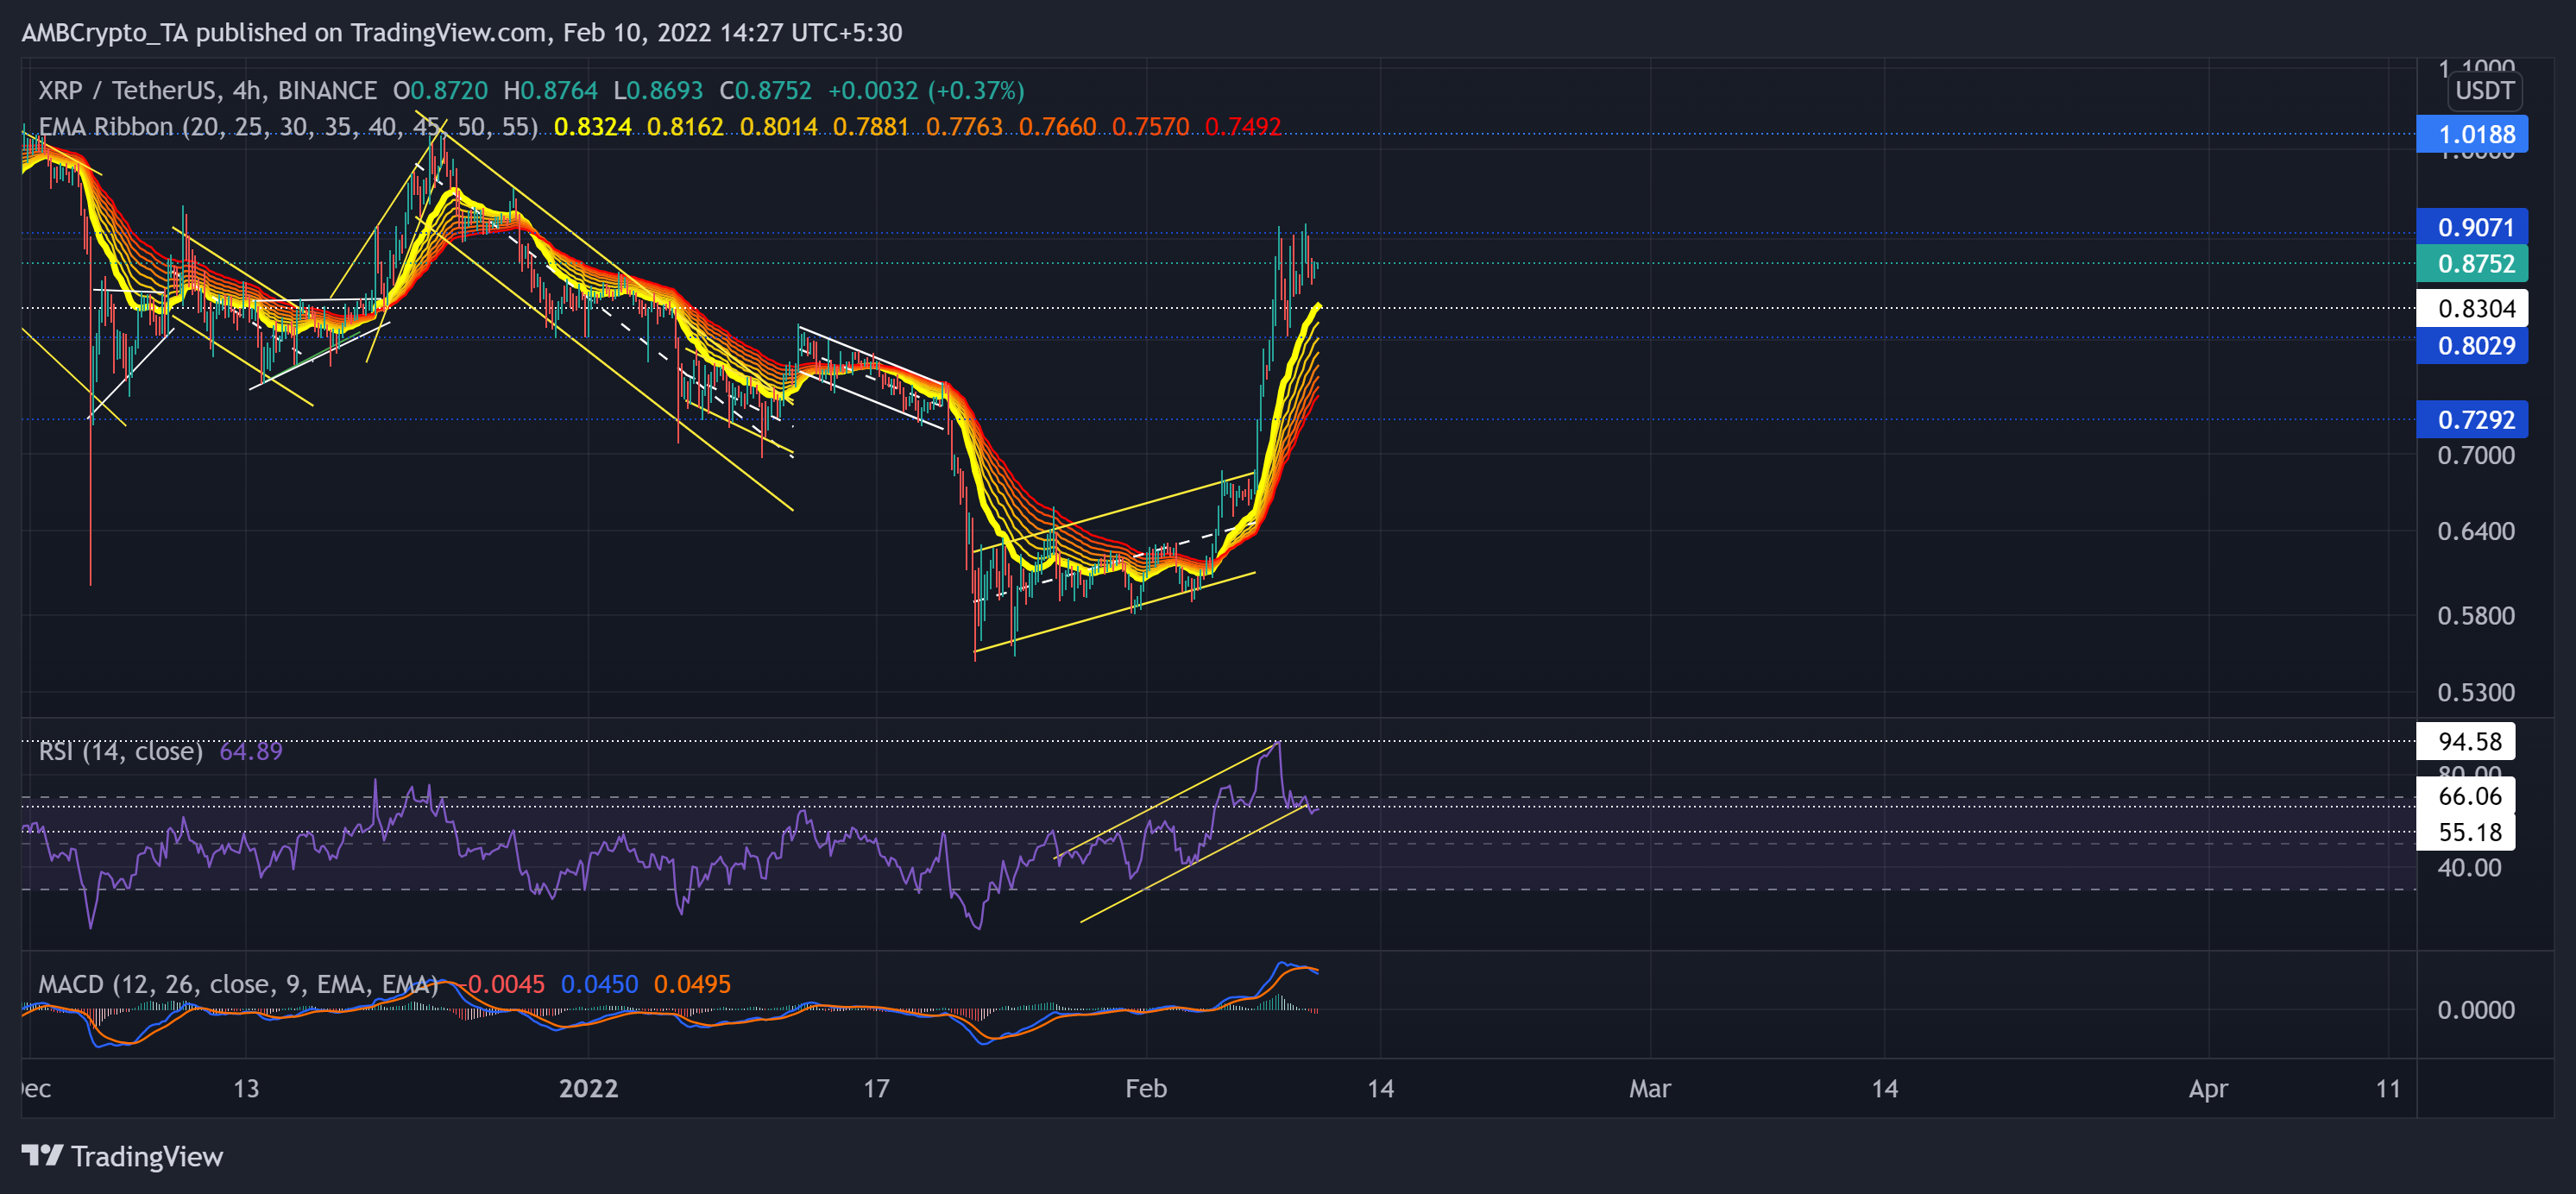
Since losing the $0.083-mark on 5 January, the alt steadily descended. Post that, the bears tested the $0.7292-mark multiple times until the 21 January sell-off. XRP plunged by 32.6% (from 12 January) to touch its six-month low on 22 January.
However, with its 67.4% revival since then, XRP flipped the EMA ribbons toward the bullish side while testing the $0.9-mark (immediate resistance). From here on, the immediate support stood at the $0.83-level that coincided with the 20 EMA.
At press time, XRP was trading at $0.08752. After testing the 55-mark multiple times, the RSI saw an exceptional surge towards its 14-month high on 8 February. After an expected reversal, it hovered around the 66-mark and still revealed a bullish edge. On the flip side, the MACD lines were still above the equilibrium but undertook a bearish crossover while the histogram plunged below the zero line.
Tron (TRX)
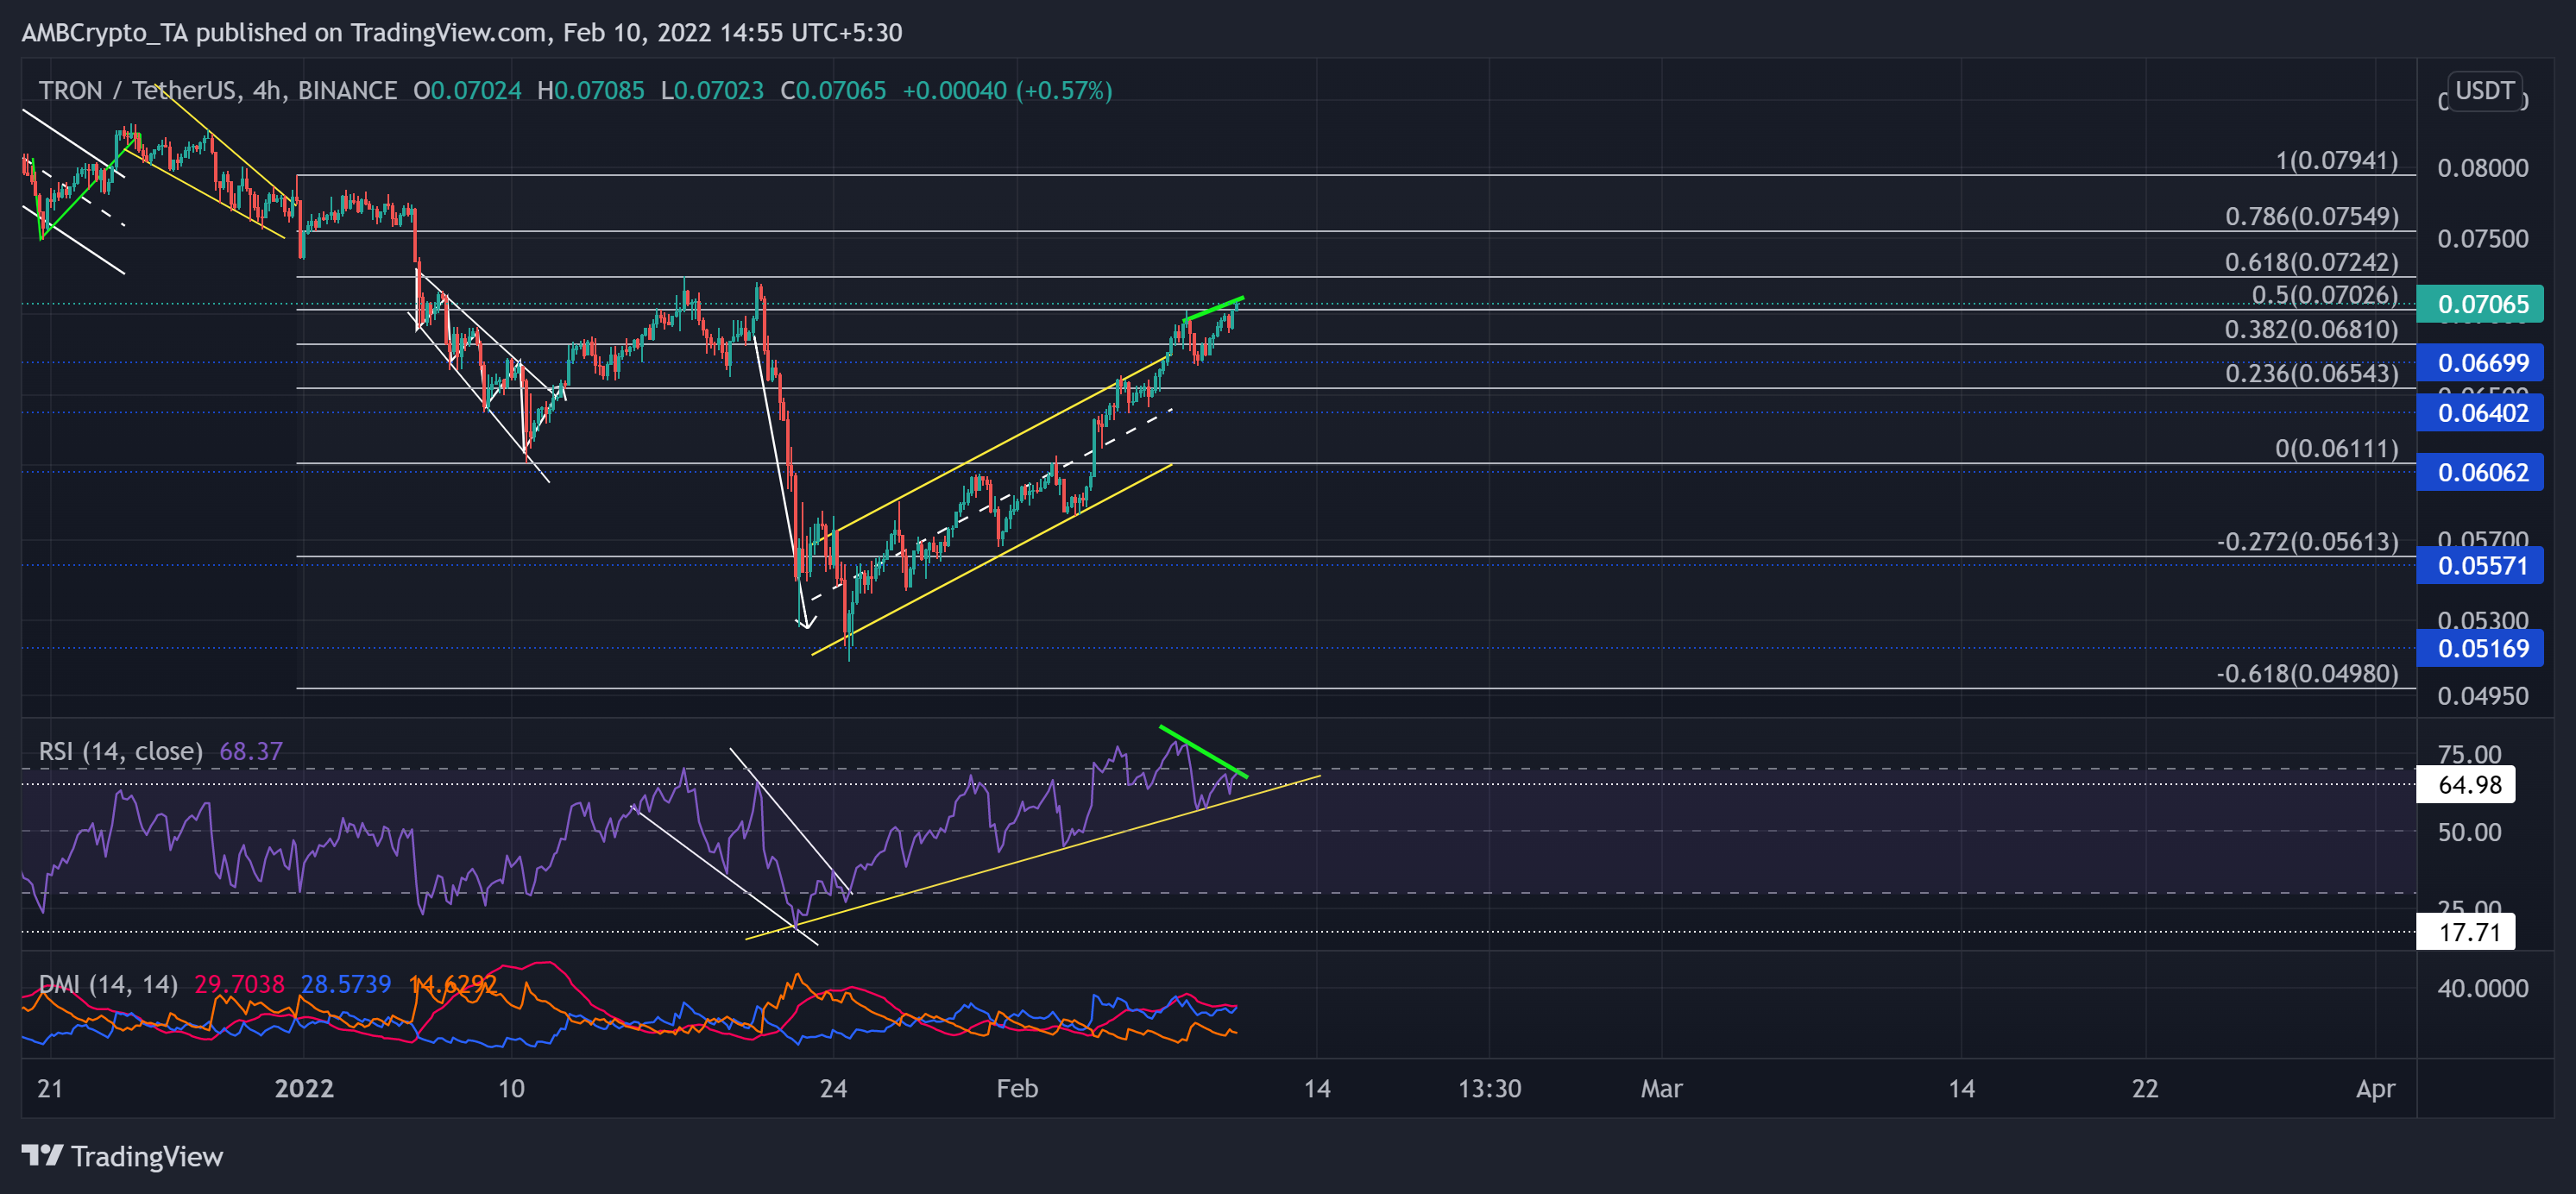
After reversing from the 61.8% Fibonacci resistance on 20 January, TRX correlated with the broader trajectory and steeply declined. The alt registered a 28.2% decline in just four days and touched its six-month low mark on 24 January.
Since the sell-off, TRX witnessed an ascending channel on its 4-hour chart and regained its previous losses. The immediate resistance stood at the 61.8% Fibonacci level.
At press time, TRX traded at $0.07065. after the falling wedge breakout, the RSI solidly upturned and formed bullish trendline support (yellow). Since 7 February, the price saw higher peaks while the RSI declined, confirming a bearish divergence (green). Nevertheless, with the +DI still looking north and in the opposite direction of -DI, TRX would justify a near-term bullish movement before a reversal.
Chiliz (CHZ)
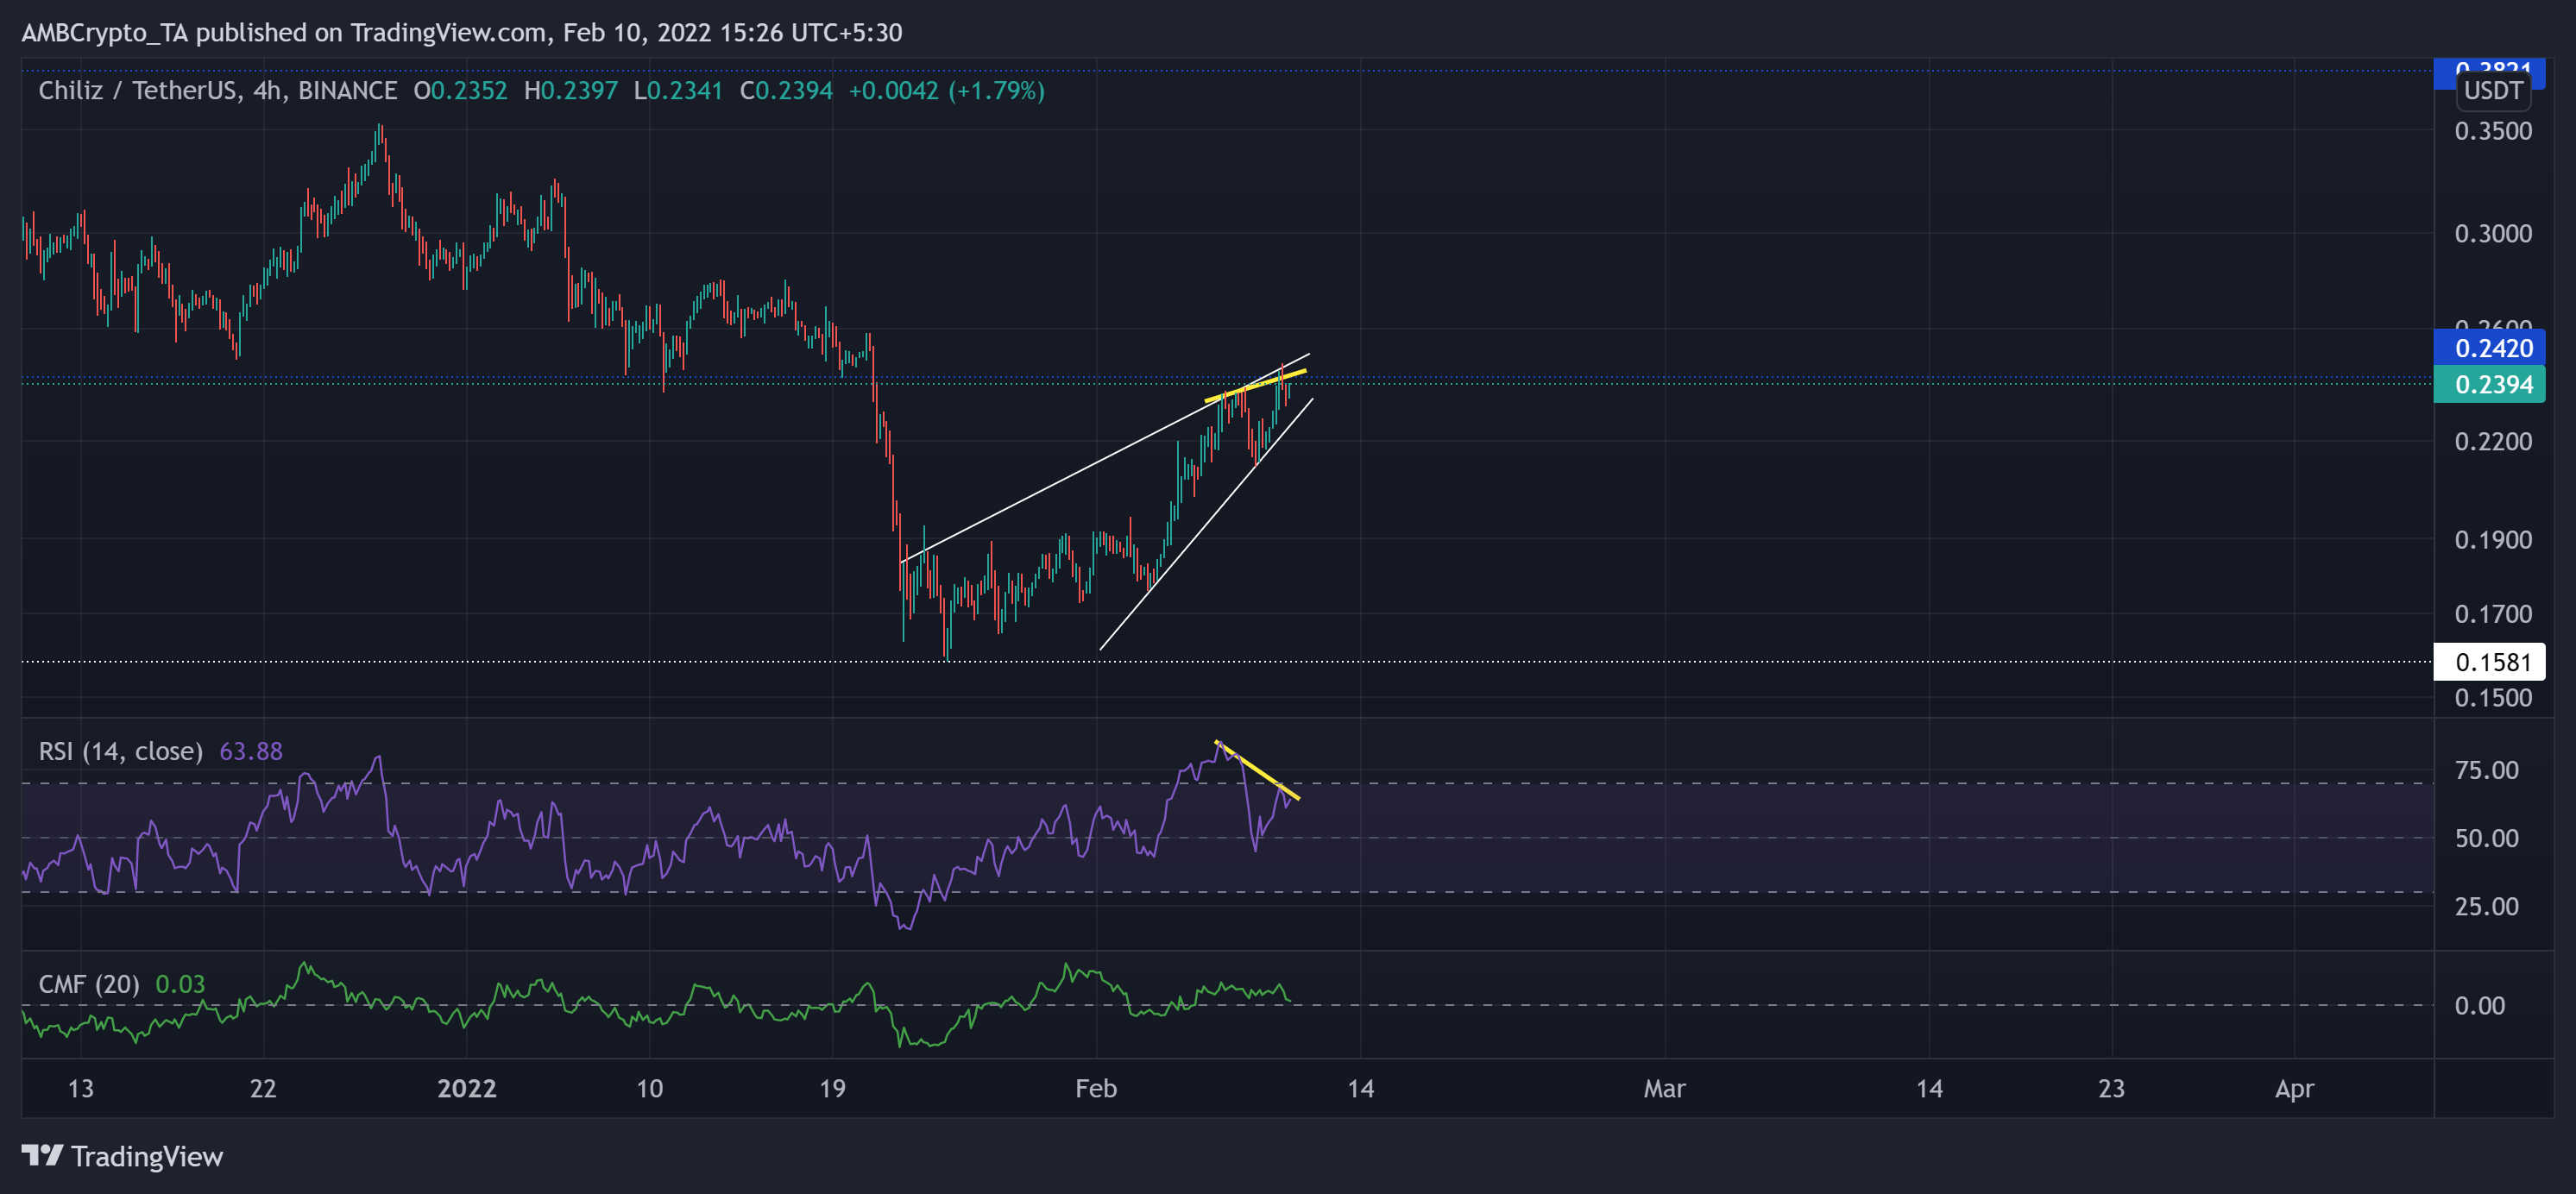
CHZ projected a nearly 56.5% upswing after picking itself up from its 10-month low on 24 January. As a consequence, the price action tested the $0.242-level. During this phase, it saw a rising wedge (white, reversal pattern) on its 4-hour chart.
The immediate testing point for the bulls stood at the $0.242-mark. The near-term technicals affirmed the buying power. At press time, the alt traded at $0.2394.
The RSI favored the bulls while swaying above the midline for the past week. Similar to TRX, CHZ’s RSI also bearishly diverged with its price, hinting at a possible slowdown. Further, the CMF confirmed a bullish advantage but seemingly approached its zero-line.