Analysis

XRP, Tron, The Sandbox Price Analysis: 26 November
Posted:
| Last updated: January 30th, 2024
contributor

While the overall market outlook skewed slightly in favor of bulls, XRP and Tron touched their multi-week lows on 24 November. A near-term bullish revival could occur if the bulls gather enough force.
Contrarily, SAND saw soaring gains as it touched its ATH on 25 November but now showed signs of slowing down.
XRP
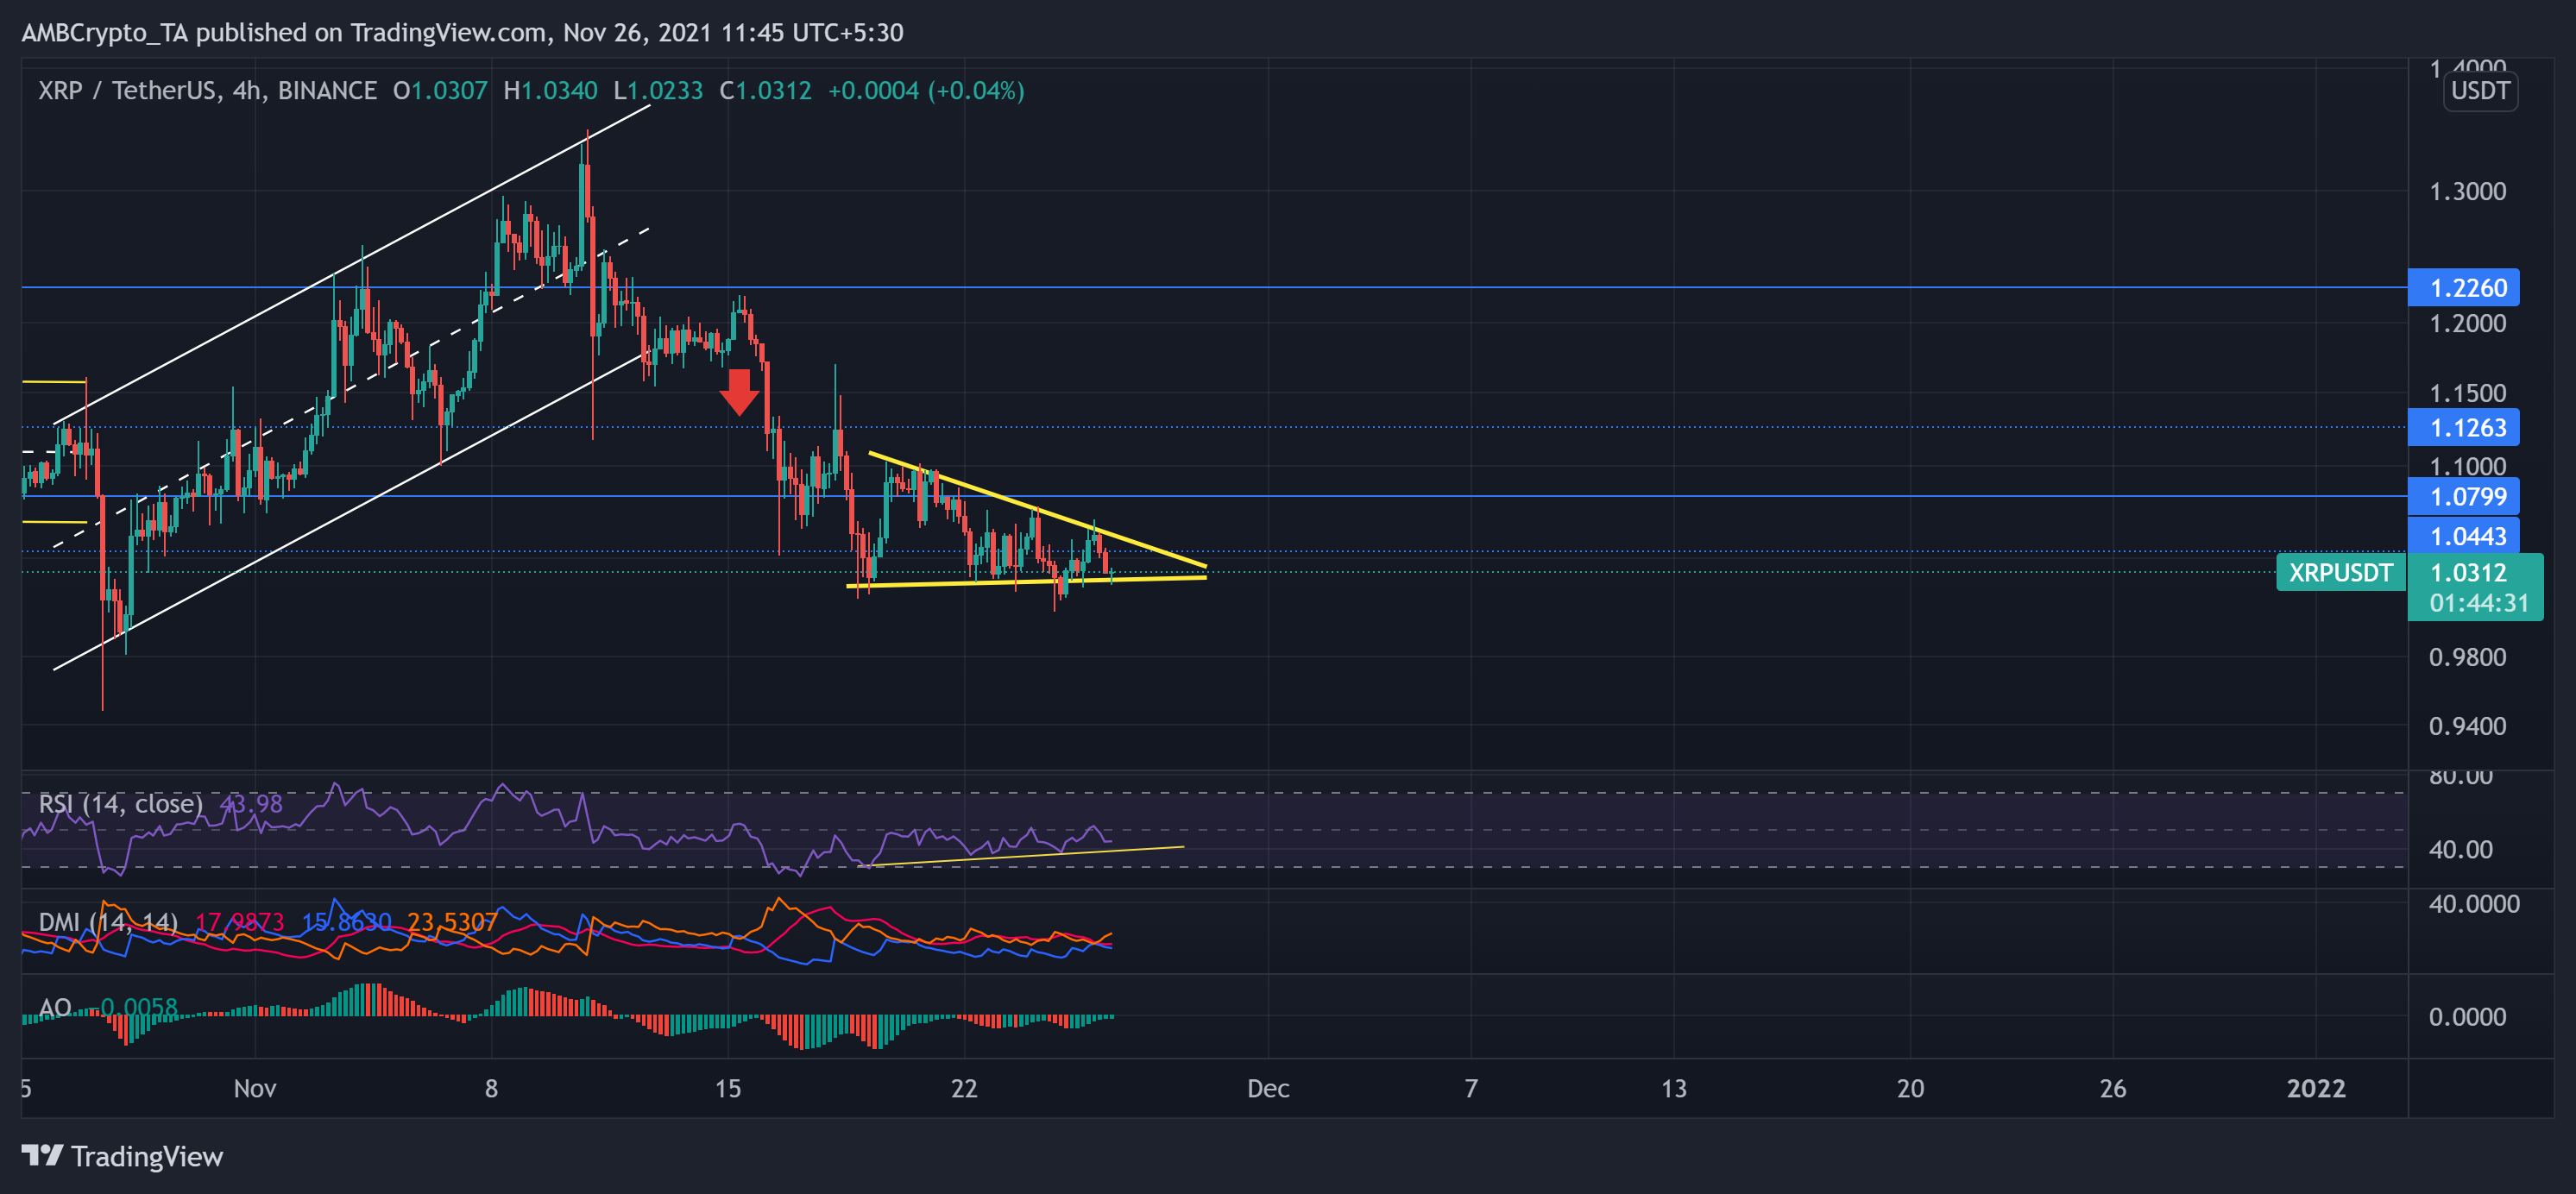
TradingView, XRP/USDT
Since last month, Ripple’s XRP witnessed a dynamic bull versus bear clash. From 27 October, it oscillated within the ascending parallel channel (white). During this phase, XRP rallied by 35% to poke its two-month high on 10 November.
Since then, however, the bulls lost their strength as the trend reversed. This pullback resulted in a 25.3% correction until the price touched its four-week low on 24 November. With this downfall, XRP formed a descending triangle pattern.
At press time, XRP was trading at $1.0312. The RSI was in an uptrend since the past week but struggled to cross the half-line. Also, the DMI displayed a bearish bias. Although AO was below the equilibrium level, it hinted at increasing bullish power. However, the ADX showed a weak directional trend. Further, a descending triangle breakout could occur if the bulls are unable to gather momentum.
Tron (TRX)
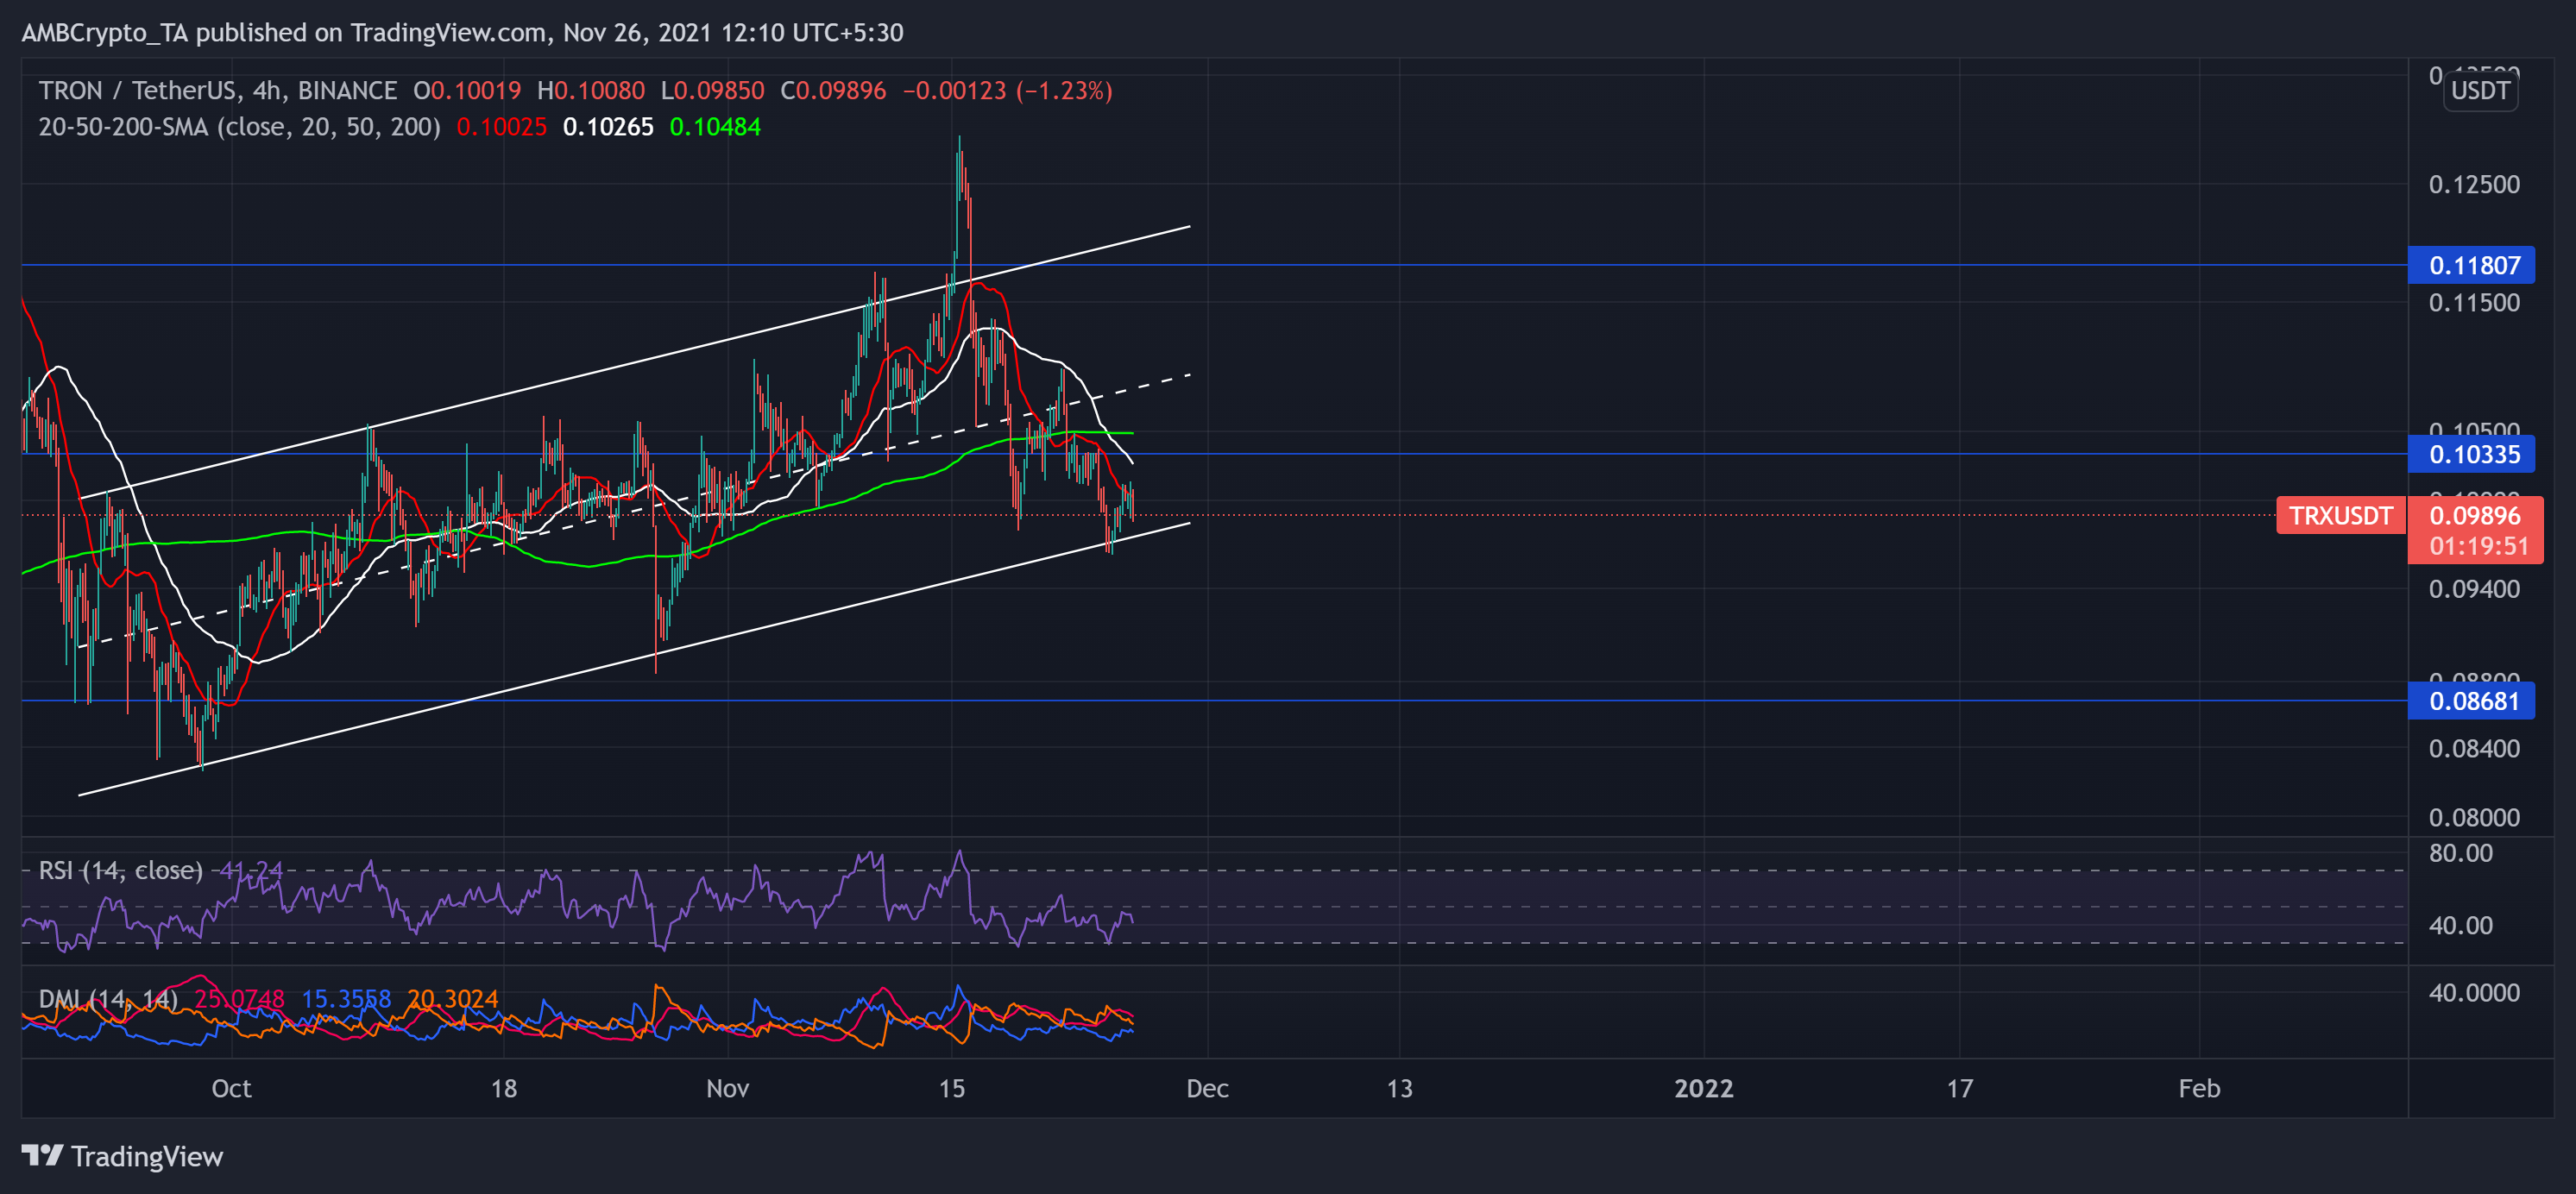
TradingView, TRX/USDT
Since late September, TRX steadily maintained and noted higher lows on its up channel. From 29 September, the alt recorded an over 54% 47-day ROI. Thus, the rally triggered the price to its six-month high on 15 November.
However, the bears continually showed resistance at the upper channel. As a result, the price moved back into the trend after noting an over 20% nine-day decline to poke its three-week low on 24 November. This fall visibly pushed the price below the 4-hour 20-50-200 SMA, depicting a powerful bearish influence.
At press time, TRX traded at $0.09896. The RSI attempted a revival but could not cross the half-line. Also, the DMI skewed in favor of the bears along with a high directional trend. Nevertheless, the bulls may trigger an uptrend once the price drops to the lower channel.
The Sandbox (SAND)
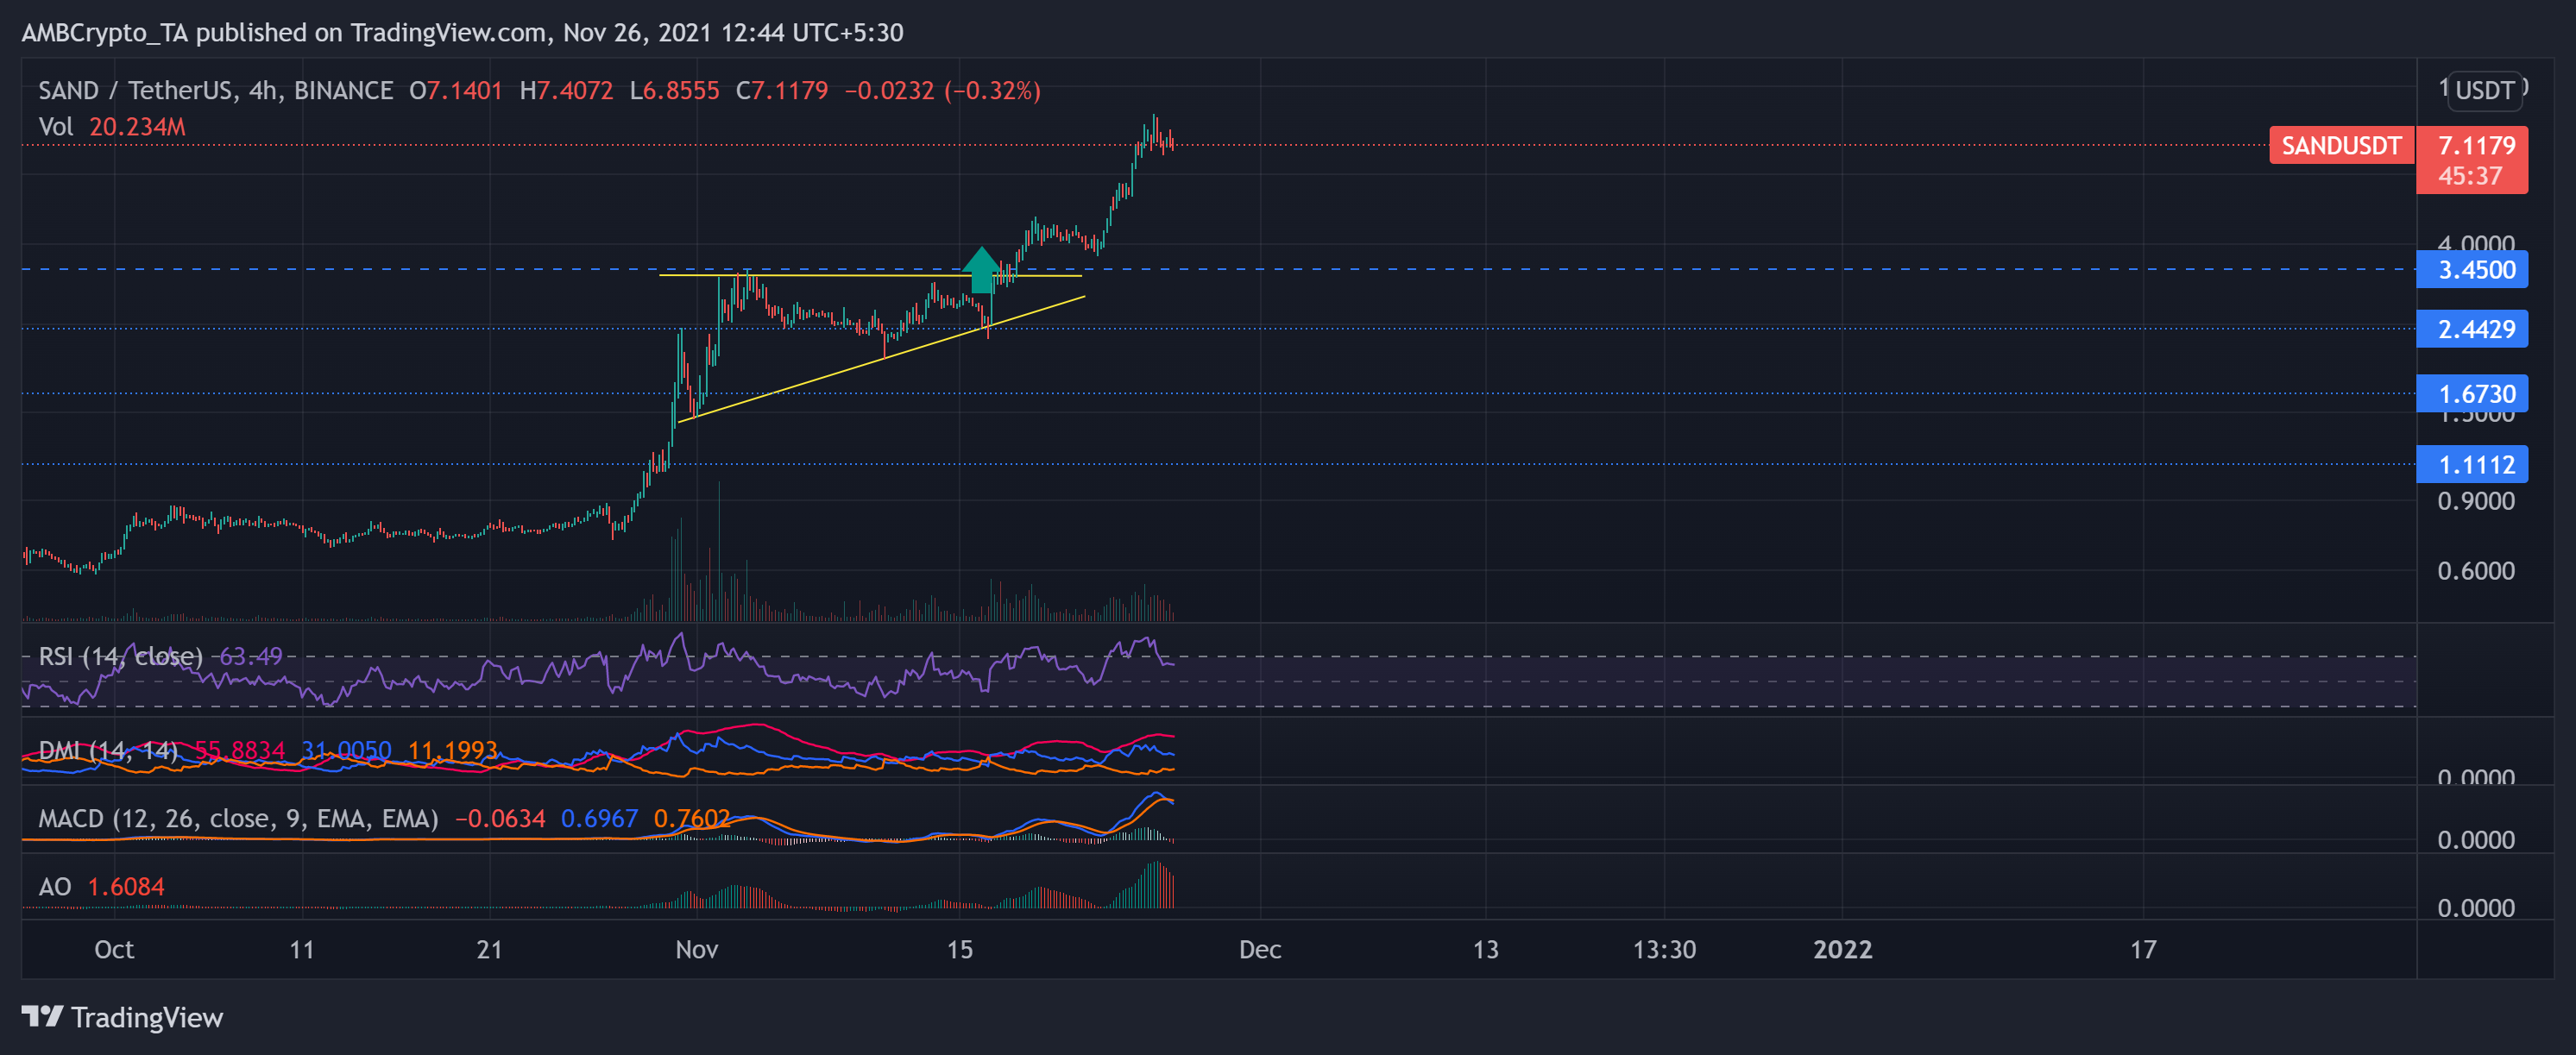
TradingView, SAND/USDT
As times for the Metaverse space keep getting exciting, SAND undeniably defied the market trend and saw exponential gains over the past month. From 28 October, SAND saw an exceptional 508% rally as it touched its then ATH on 18 November.
The price action formed an ascending triangle pattern (yellow). Consequent to the announcement of its upcoming project, the price saw a breakout and went into discovery mode. Further, the recent tie-up with Adidas and its developments in the metaverse bolstered the price action to touch its ATH on 25 November.
However, at press time, the alt traded at $7.1179 after noting a 14.28% 24-hour loss. The RSI plunged from the overbought territory to the 63-mark. While DMI preferred the bulls, MACD and AO hinted at their decreasing strength.