XRP’s price continues to consolidate but bulls appear on the horizon
Posted:
| Last updated: January 30th, 2024

XRP’s bearish woes in the market continued as the virtual asset slumped by 2.34 percent over the last 24 hours. At press time, XRP was valued at $0.289, with the market capitalization recorded at around $11.9 billion.
XRP’s trading volume was relatively healthy however, registering over a $1.5 billion, with the virtual currency trading the most on HCoin exchange, which contributed around $101 million of the total volume.

Source: CoinStats
XRP 1-hour chart
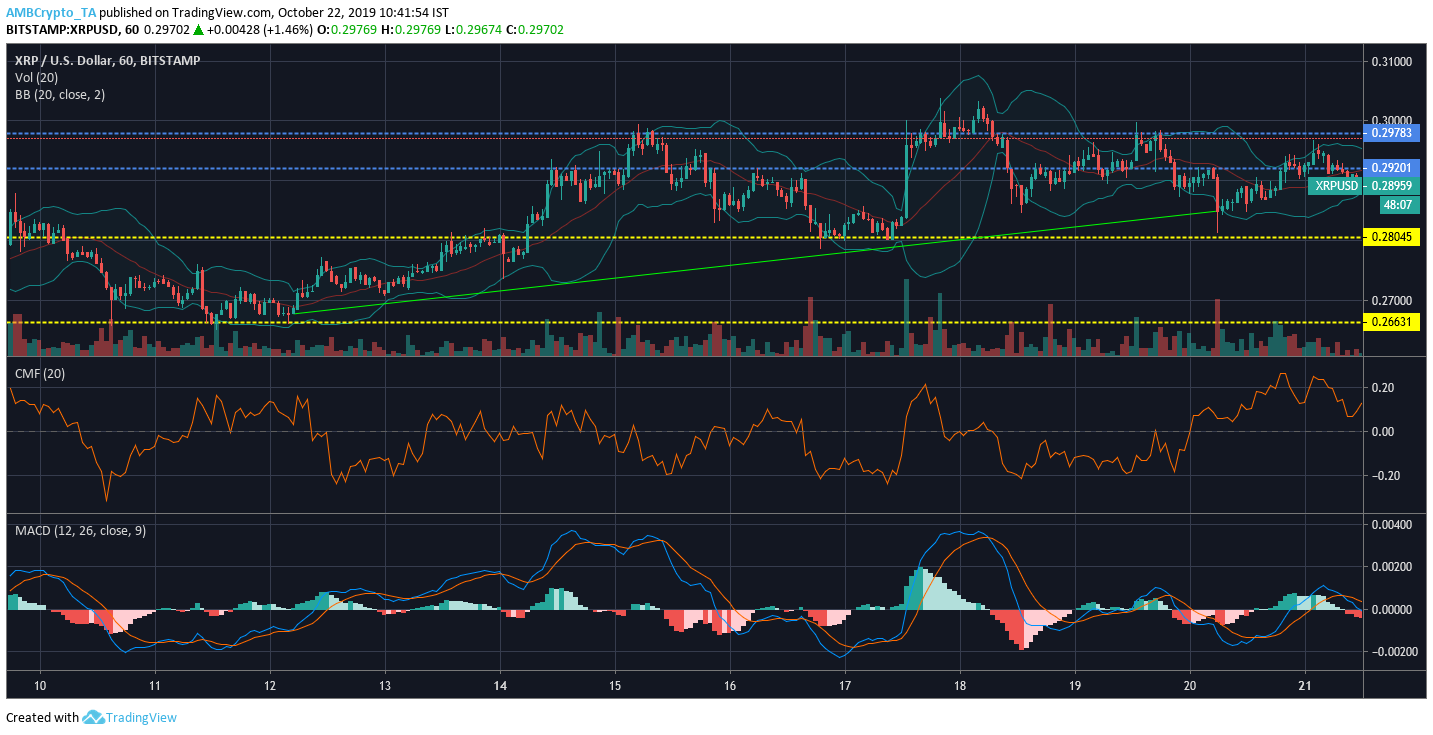
Source: XRP/USD at Trading View
Resistance 1: $0.297
Resistance 2: $0.292
Support 1: $0.280
Support 2: $0.266
The Bollinger Bands were converging in the chart and suggested reduced volatility for the token.
The Chaikin Money Flow or CMF suggested that the money flowing into the market was more than the money flowing out as the CMF line remained above the zero-line.
The MACD line indicated a bearish trend as the signal line hovered over the MACD line.
XRP 1-day chart

XRP/USD at Trading View
Resistance 1: $0.427
Resistance 2: $0.319
Support 1: $0.231
The Parabolic SAR remained bullish for the token as the dotted markers remained below the candlesticks.
The Awesome Oscillator suggested that market momentum was bullish as green bars appeared in the charts.
The Relative Strength Index or RSI was close to the overbought section after the RSI line hovered near the 60-line marker.
Conclusion
The bulls seemed to appear from XRP’s price movement as the bears were loosening their grip on the token’s market.