Zcash Price Analysis: 13 January
Disclaimer: The findings of the following analysis are the sole opinions of the writer and should not be taken as investment advice
Zcash, at the time of writing, was in a unique spot in the market. While the rest of the crypto-market was consolidating at a lower range, ZEC managed to rally back to its yearly high of $110. In fact, valued at $106 at press time, the token had already registered a new high above $110 in the last 6 hours. However, a minor pullback might be on the horizon for ZEC. At press time, Zcash had a market cap of $1.13 billion.
Zcash hourly chart

On the hourly timeframe, Zcash was exhibiting the formation of a rising wedge pattern, one implying a bearish condition over the cryptocurrency’s immediate future. With respect to the market structure, the price may follow the orange path, dropping below $100 over the next few hours. On the other hand, a breakout may take place later in the week but the chances of pattern invalidation increase if the price consolidates above $110 on the chart.
The trading volume, at press time, supported a bearish narrative as the decreasing volumes with improving price was a bearish divergence alert. Finally, the 20-Moving Average and 50-Moving Average continued to provide support to Zcash’s price rally.
Market Rationale
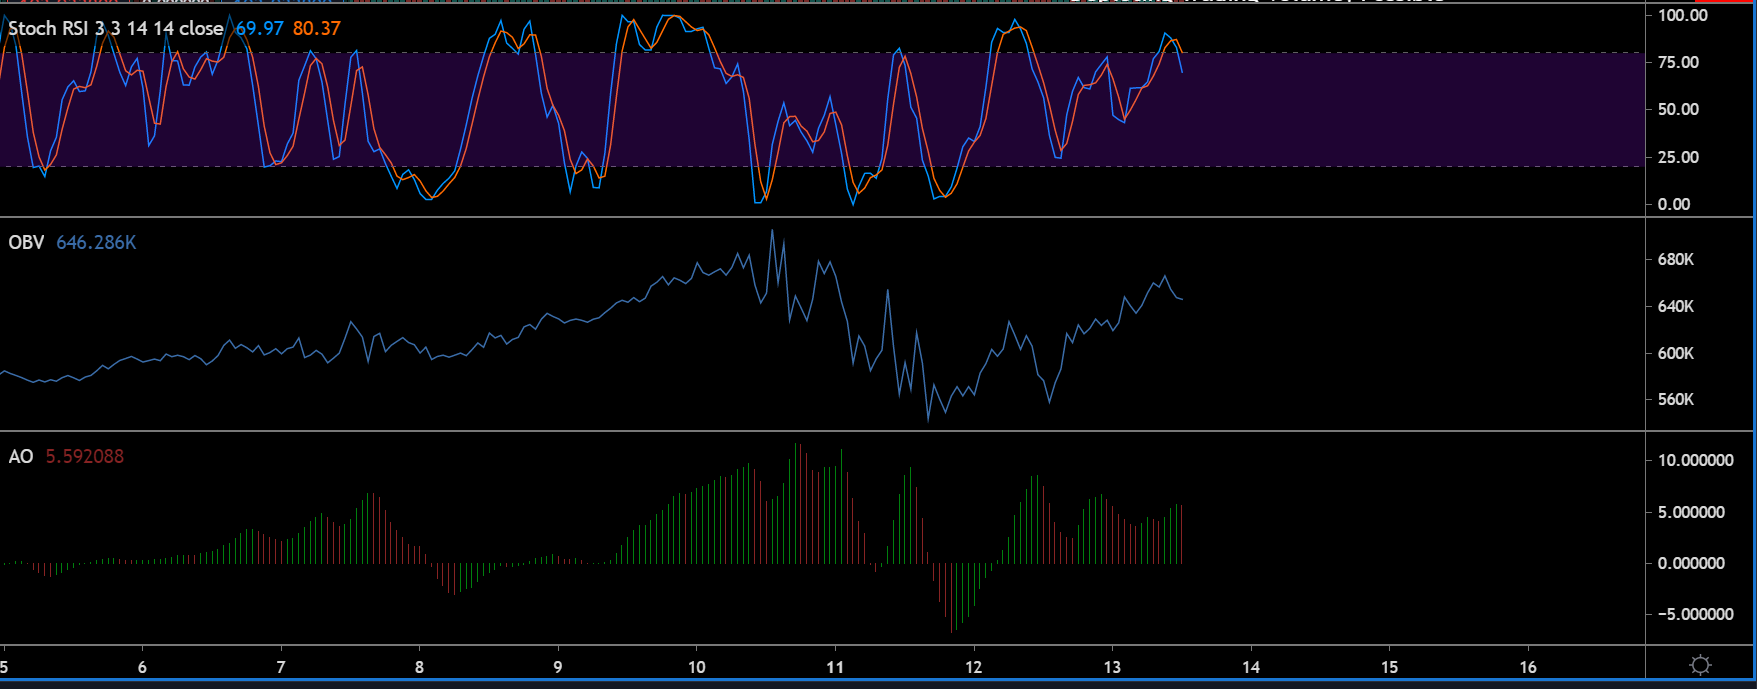
The Stochastic RSI appeared to be on a path of correction after the bearish indicator completed a crossover above the bullish indicator in the overbought region. It was clearly a sign of corrections going forward.
The On-balance Volume maintained higher levels, but the market’s sellers would have a higher incentive to trade Zcash at the press time price point.
Finally, the Awesome Oscillator maintained neutral momentum. While the red candles were evident on the chart, the trend appeared largely balanced at the time of writing.
Weekly Chart remains positive
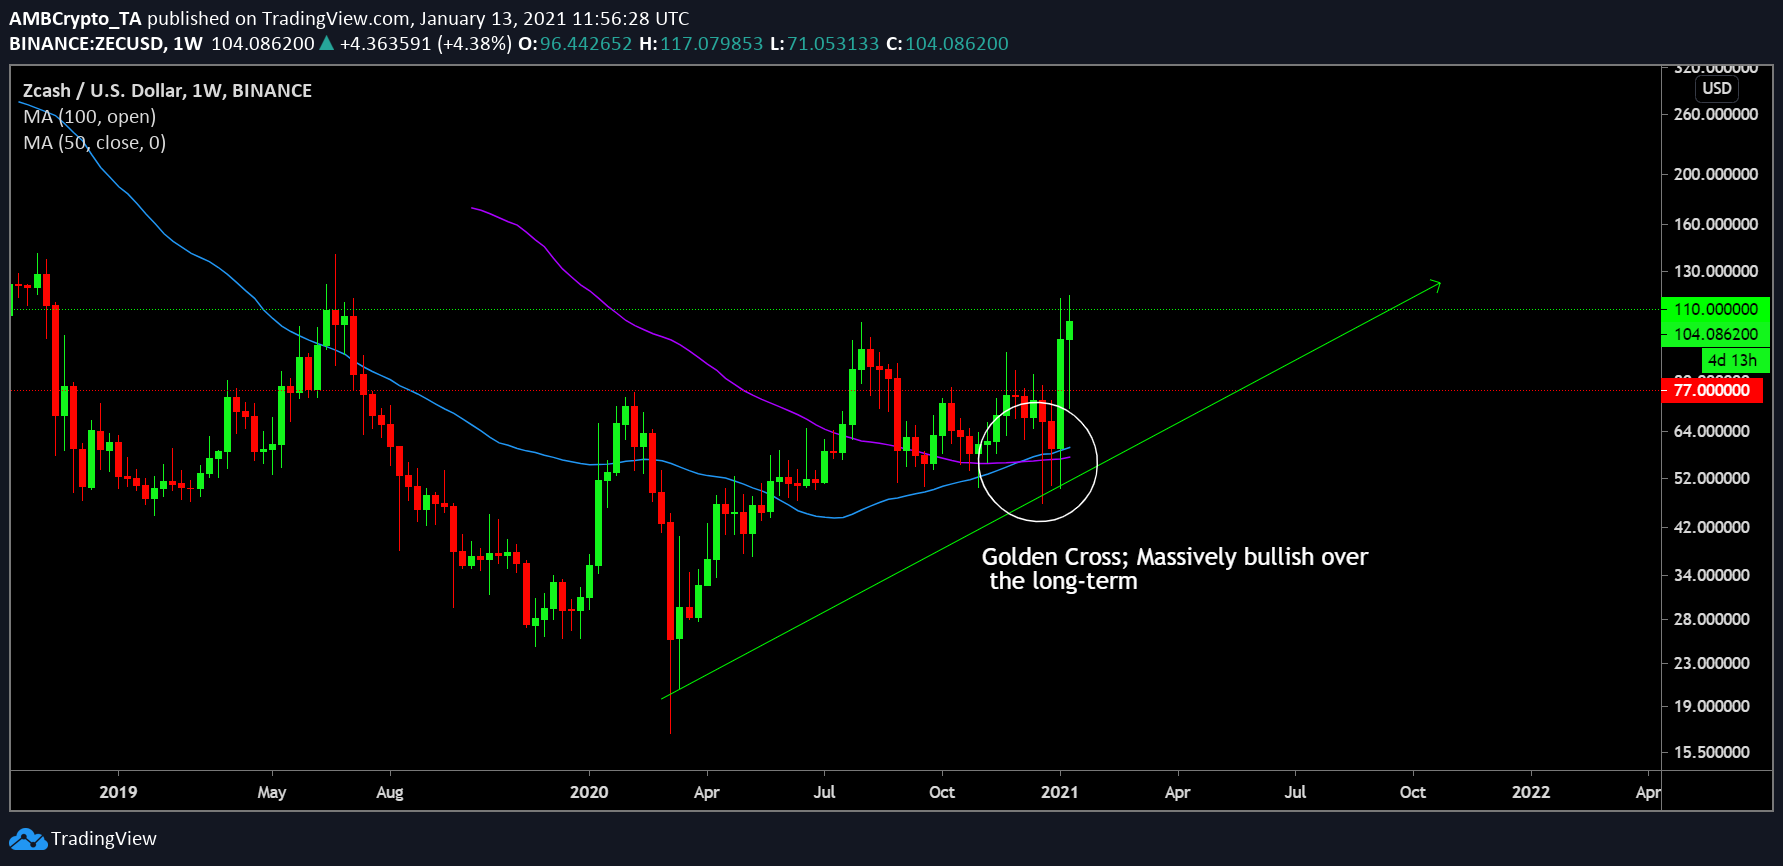
One major bullish sign for Zcash on the weekly chart was the completion of its 1st Golden Cross in the long-term market. $77 is currently acting as weekly support and the price closing above the support level is a major positive. In fact, the ascending support level hasn’t been breached since April 2020, other than a mild re-test last week.