Zilliqa has seen a pullback to this level; further upside was likely?

Disclaimer: The findings of the following analysis are the sole opinions of the writer and should not be considered investment advice
Buy the rumor, sell the news, goes the adage. Zilliqa and its token ZIL have seen massive hype on the internet and on social media recently. The price of ZIL has also risen by nearly 400% in recent weeks in the wake of the optimism surrounding Metapolis, the metaverse-as-a-service platform of Zilliqa. It is scheduled to launch on 2 April 2022 with a VIP event in Miami.
ZIL- 1H
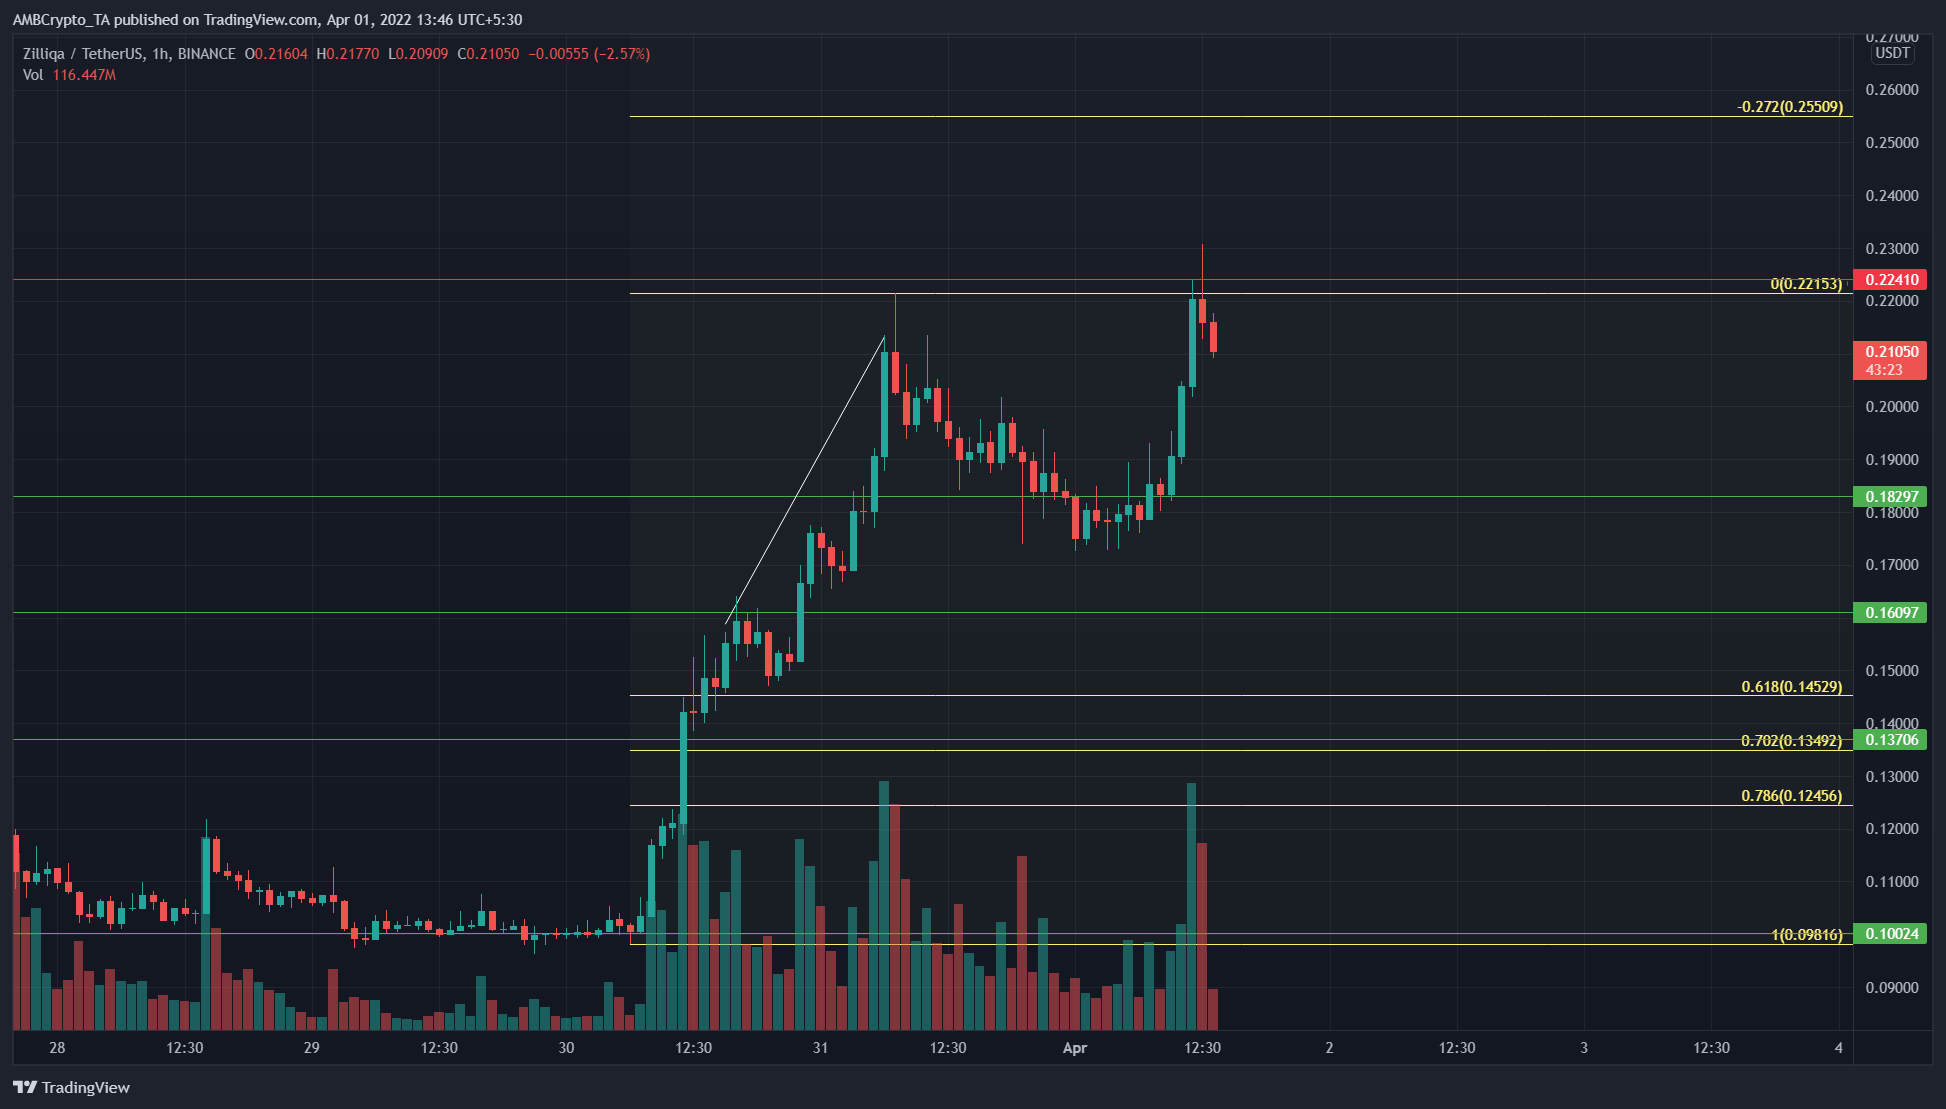
The short-term Fibonacci retracement levels (yellow) plotted for ZIL’s move from $0.098 to $0.221 in the past few days showed that the price was too bullish to recede anywhere close to the 61.8% retracement level.
Instead, the $0.182 level of horizontal support was visited following a bearish divergence on the hourly chart between the asset price and its momentum (RSI).
Following this pullback, ZIL has seen a quick, impulse move back upward following the retest of support. At the time of writing, it was attempting to break past the $0.224 resistance level.
Rationale
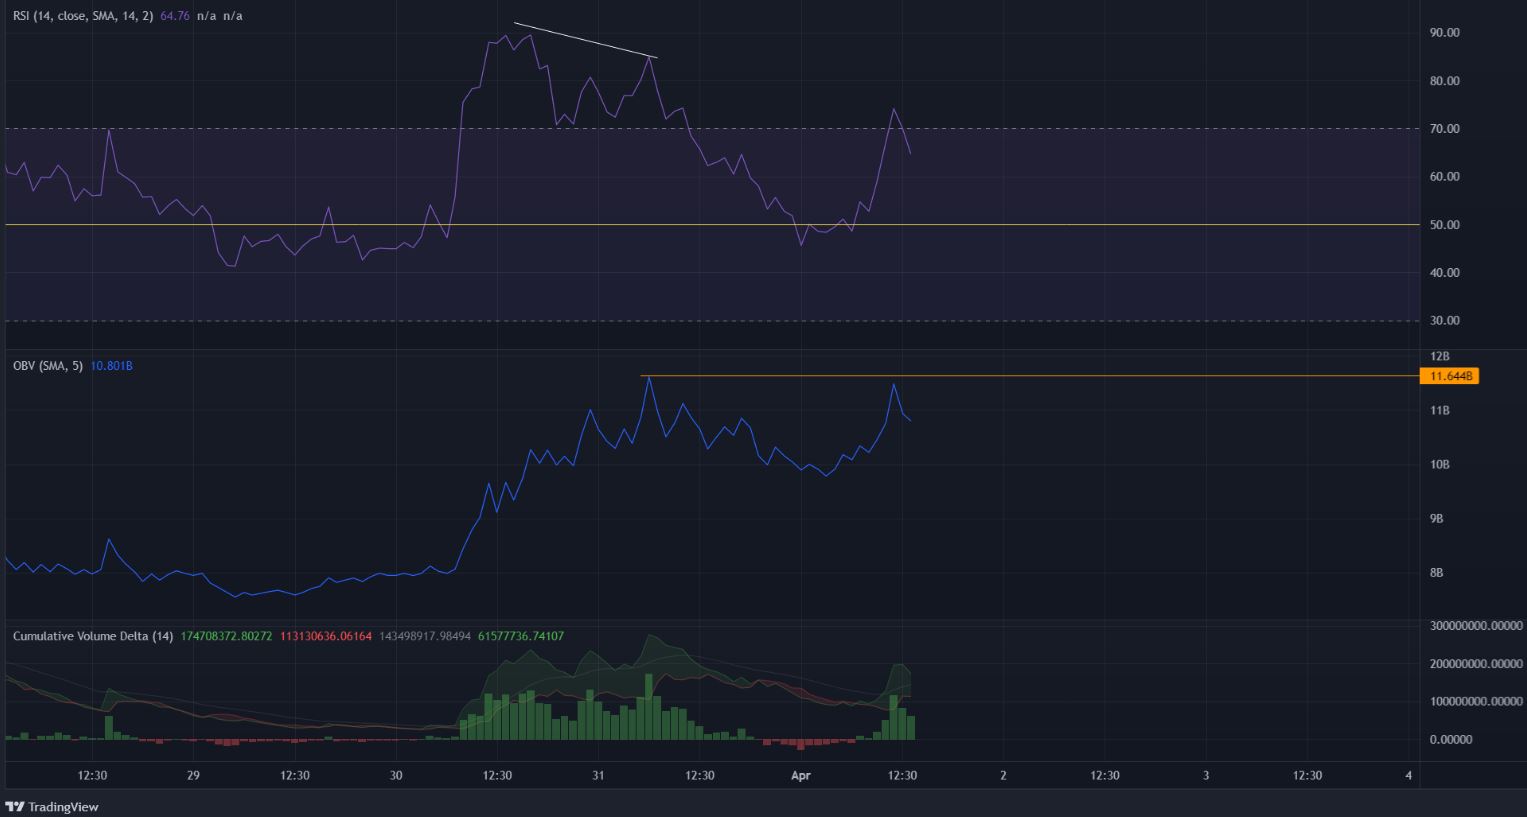
The RSI on the hourly chart had not dipped significantly beneath the neutral 50 line, even on the pullback to $0.177 which represented a 15% drop. In the past few hours, the RSI surged once more to show that the trend and momentum were strongly bullish.
The OBV, just like the price, was also attempting to climb past a local high. If the OBV does accomplish this in the next few hours, it would be another sign of strong buying pressure. The CVD was also green in recent hours, to highlight the demand.
Conclusion
The indicators and the price charts had a bullish outlook on the lower timeframes. On the other hand, the 4-hour and 6-hour charts had bearish divergences beginning to crop up. Moreover, since the Metapolis event is scheduled for this Saturday, it could so happen that excited retail buyers buy ZIL and provide exit liquidity to the larger players in the market. Therefore, for late buyers, caution is advised.