Bitcoin, Ethereum and Litecoin Price Analysis: 08 August

Bitcoin closed above $45,000, for the first time since May 19, and this milestone pumped the altcoins too. BTC’s next resistance is at $48,000, whereas, Ethereum eyed a move towards $3500. Conversely, Litecoin failed to mimic its larger counterparts as it noted a minor decline in prices.
Bitcoin (BTC)
BTC/USD, TradingView
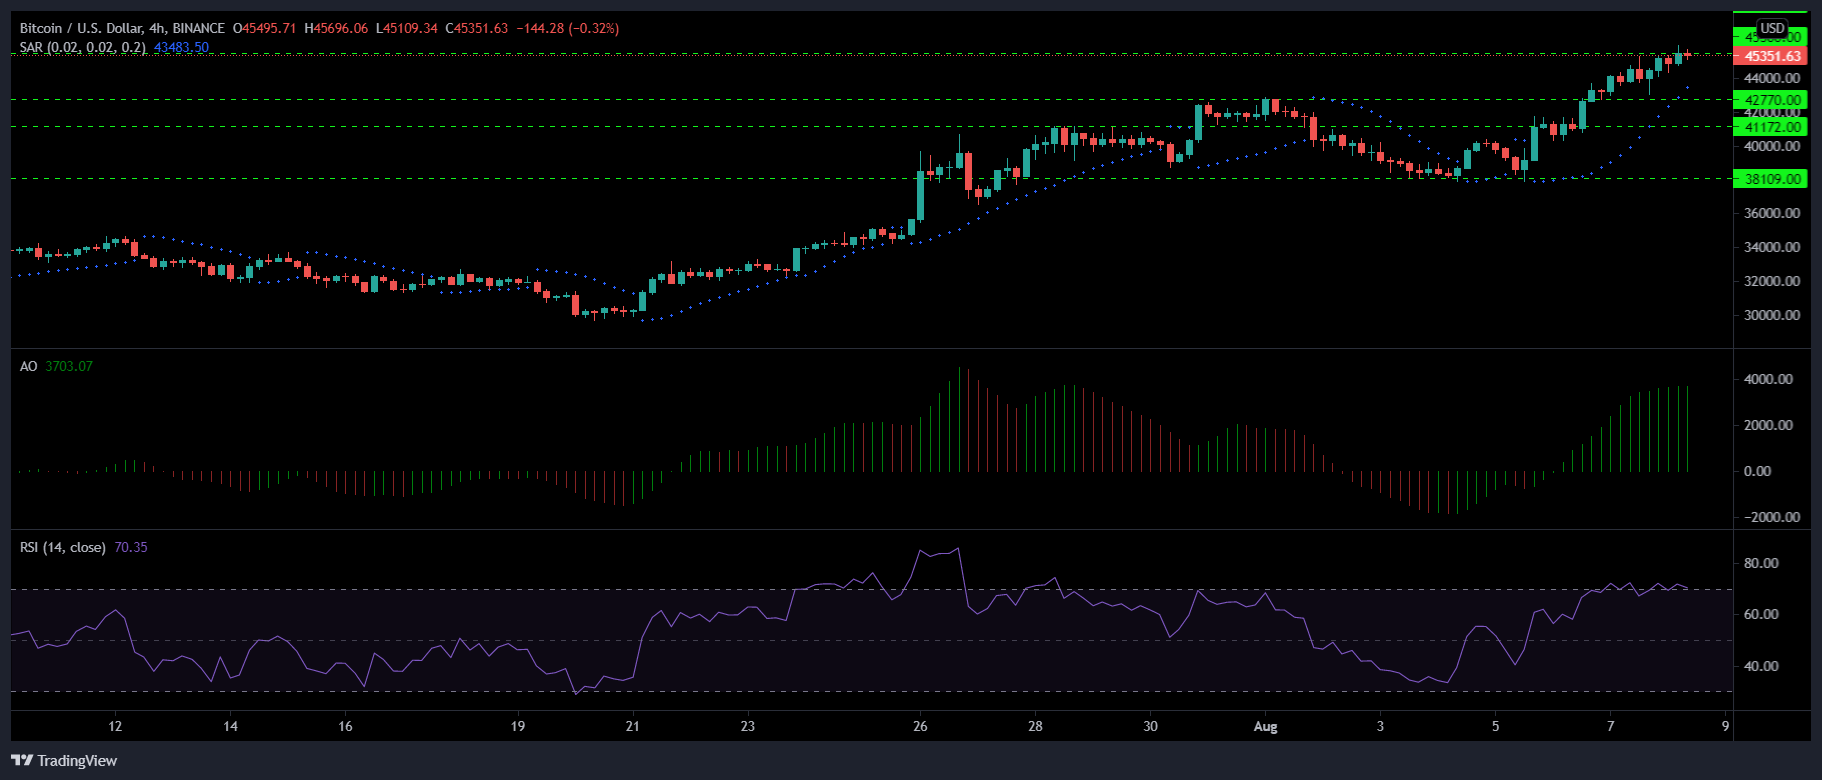
BTC traded at $45,312 after closing above an important resistance level of $42,000. The next is resistance at $48,000. The 4-hour chart of BTC pointed towards strengthening of the bulls in the market.
Parabolic SAR’s dotted lines were seen below the candlesticks implying a rise in prices. Green signal bars amplified on the Awesome Oscillator suggesting bullish momentum along with an increased buying pressure. The Relative Strength Index was spotted in the overbought zone validating the aforementioned statement.
In case of a decline, the first support lies at $42,770 and then at $41,172.
Ethereum(ETC)
ETH/USD, TradingView
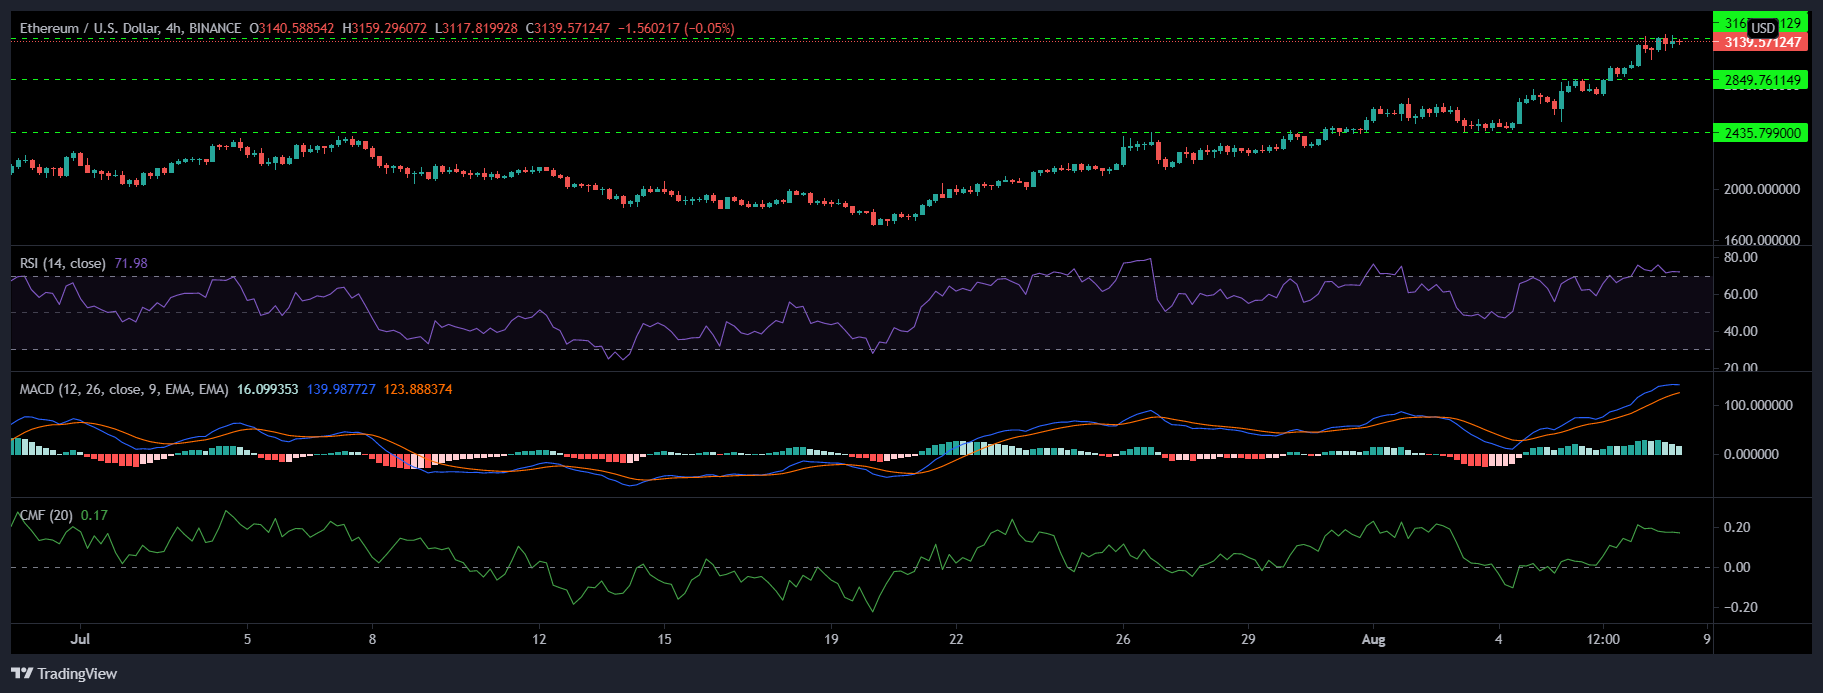
Ethereum registered impressive gains right after the London Hard Fork. It gained almost 15% over the last two days after the London Hard Fork. It was valued at $3139 at press time, however, it recorded minor gains of 2% since yesterday.
If ETH continues to rise, the resistance to watch out for, would be at $3500. On the flip side, the support region for ETH is at $2800 and $2400.
Buying pressure mounted as the Relative Strength Index displayed overbought conditions in the market. Capital inflows remained higher than outflows at the time of writing and the MACD indicator continued to observe green bars, however, the indicator also noted declining bullish momentum.
Litecoin (LTC)
LTC/USD, TradingView
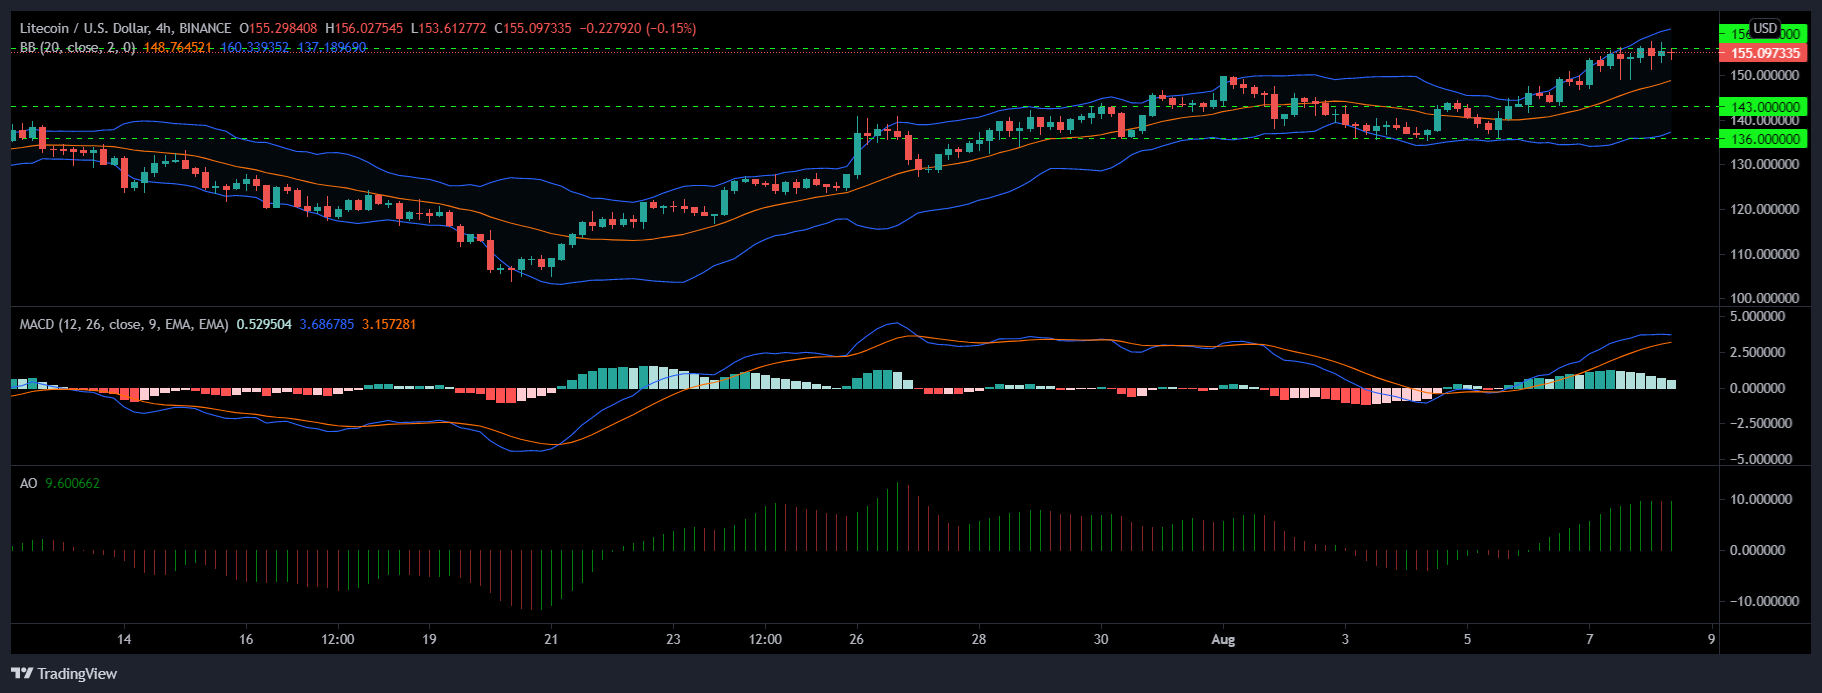
LTC was priced at $155 after it increased by 1% yesterday. The technical outlook for LTC remained bullish. However, if the coin remained at the current price level over upcoming trading sessions, it could fall to its support level of $143.
On the upside, it could again try to cross the $156 resistance level. MACD despite trading above the half-line noted receding buying pressure. Awesome Oscillator displayed a green signal bar after a session of trading in the red, which verified the ab0ve mentioned reading.
Bollinger Bands, however, opened up underlying chances of increased market volatility.

