Cardano, Solana, Algorand Price Analysis: 04 October
The cryptocurrency market displayed a downfall in prices over the last 24 hours as several industry altcoins met with lower buying strength. Cardano was trading close to the immediate support of $2.13 and Solana declined by 3.3% despite its buying strength being in the positive zone. On the other hand, Algorand brought in a considerable gain of 9.6% and was nearing its three-week high price level.
Cardano (ADA)
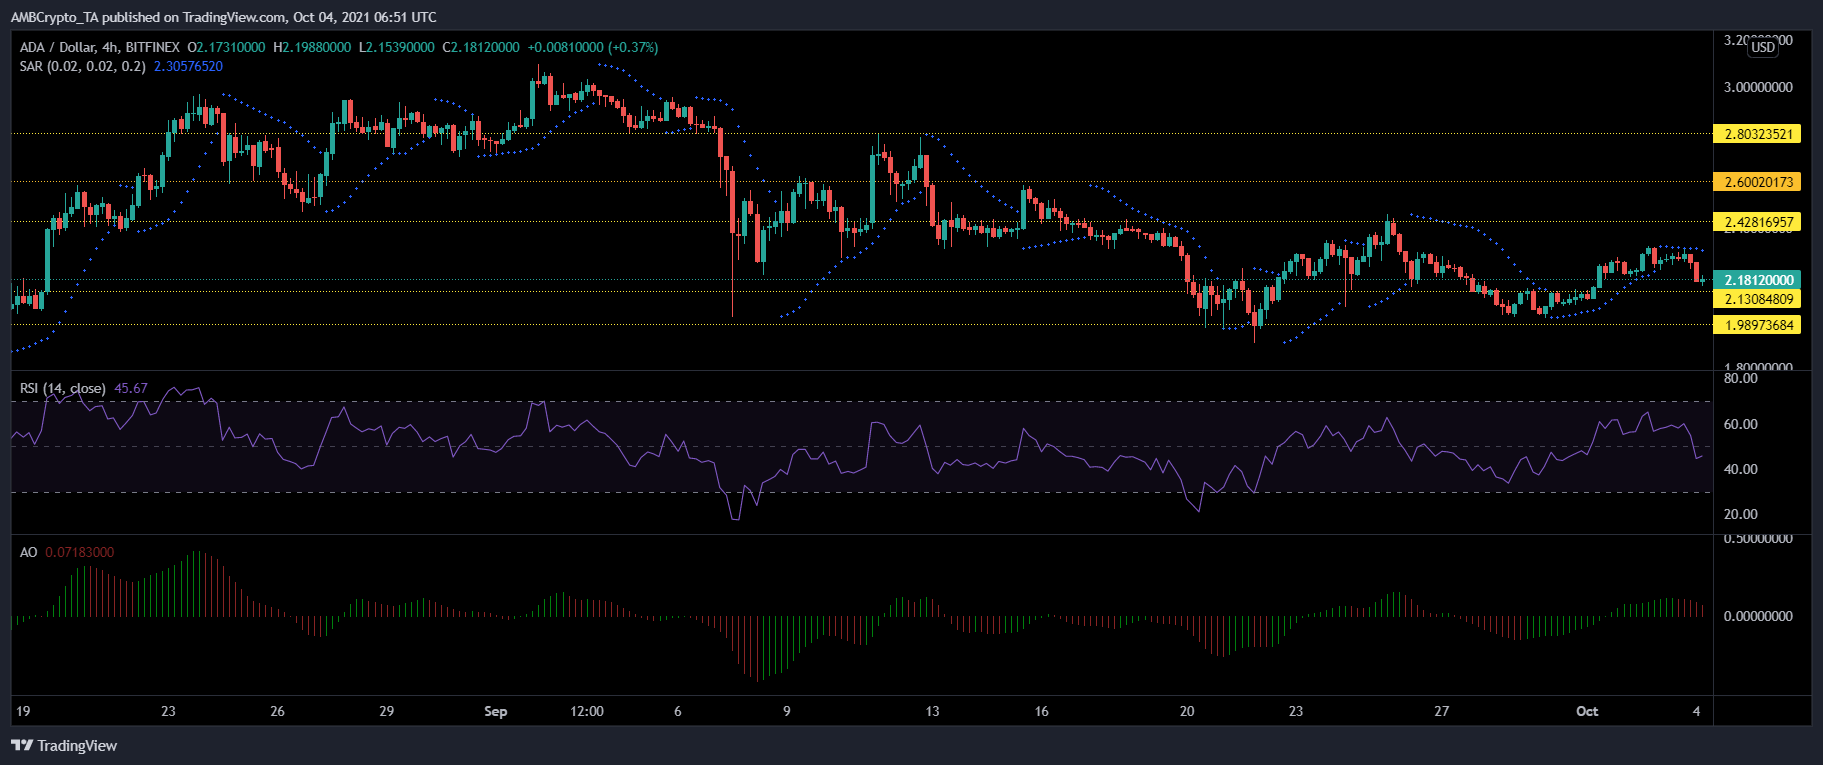
Cardano fell nearly 4.5% over the last 24 hours and was trading at $2.18. The coin met with a sell-off over the past day that resulted in a drop in prices. A move beneath its current price level can push the coin to trade near its support level of $2.13 and then at $1.98. Technical indicators pointed towards bearish price action.
The Relative Strength Index was parked in the bearish zone as the coin displayed increased selling pressure. Parabolic SAR also demonstrated a downtrend as dotted lines were seen above the candlesticks. Awesome Oscillator also started to flash red signal bars, one after the other as the past trading sessions were in the red.
In the event of buying pressure re-entering the bullish zone, it could drag prices up to touch the one-week high of $2.42. The other additional price ceilings stood at $2.60 and $2.80, respectively.
Solana (SOL)
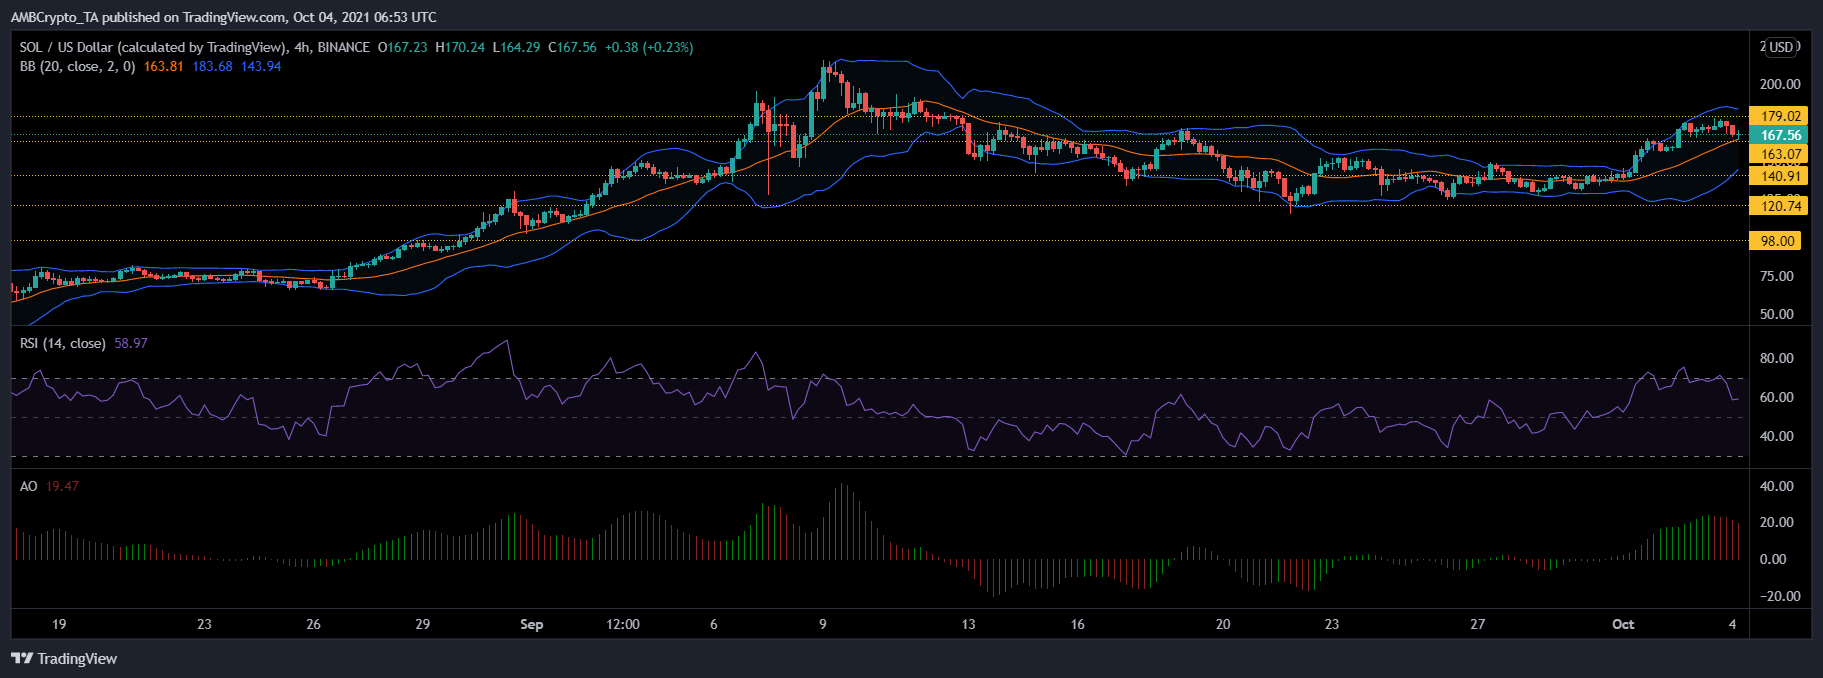
Solana declined 3.3% over the last 24 hours and was trading at $167.56. It could meet its immediate support level at $163.07 and then at $140.91. Additional price floors for the coin stood at $120.74 and then at $98. Although buying pressure existed in the market, the technical outlook for SOL took a bearish turn over the past day.
The Awesome Oscillator flashed red signal bars. Bollinger Bands contracted which indicated that price volatility would be below over the next trading sessions. The Relative Strength Index was however in the bullish zone near the 60-mark despite noting a fall in buying strength.
If the buying pressure continues to remain above the mid-line prices could witness a recovery and attempt to revisit the $179.02 price ceiling.
Algorand (ALGO)
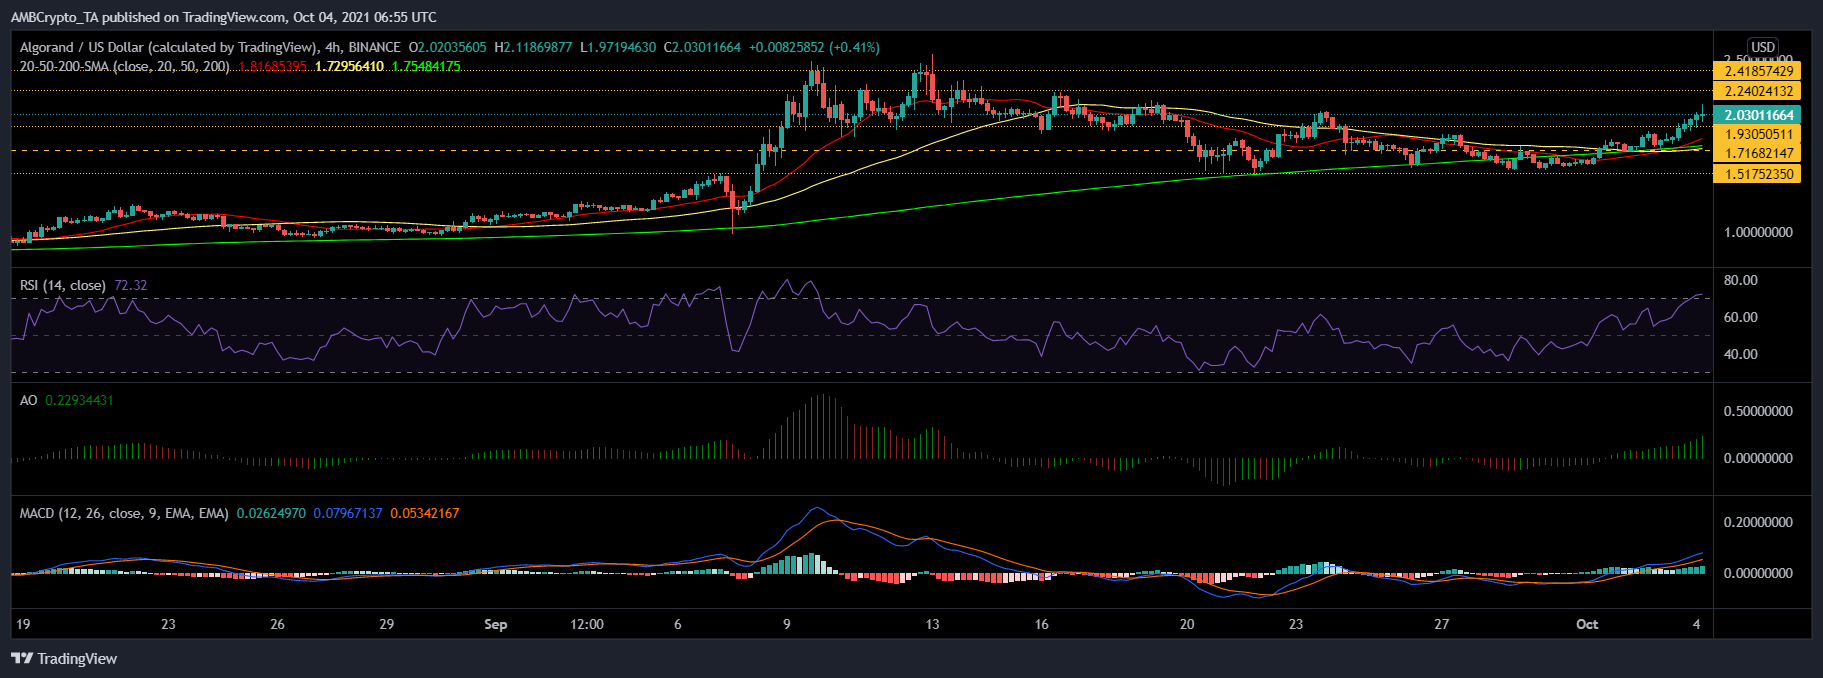
Algorand however, displayed a move in contradiction to the overall market. It gained 9.6% over the last 24 hours and was priced at $2.04. The buying strength shot up over the last day, which is why ALGO shot up. The immediate overhead resistance for the coin was at $2.24 and then at ALGO’s multi-week high of $2.41.
On the four-hour chart, ALGO’s price was above the 20-SMA which indicated that price momentum was inclined towards the buyers.
The Relative Strength Index was on a three-week high as ALGO was overbought. Awesome Oscillator displayed green signal bars. MACD also demonstrated green bars on its histogram which signified that prices were bullish.
The coin’s corrective pullback can bring prices down to $1.93 and then to $1.71. The other price floor for Algorand was at $1.51.

