Cardano, Polkadot, Algorand Price Analysis: 29 December

The last two days marked a substantial hindrance to the recovery window. Consequently, Large-cap alts like Cardano and Polkadot along with Algorand saw double-digit losses after touching their three-week high on 27 December.
While Cardano flipped the $1.47 from support to resistance, Polkadot and Algorand dipped below their 20-50-200 SMA.
Cardano (ADA)
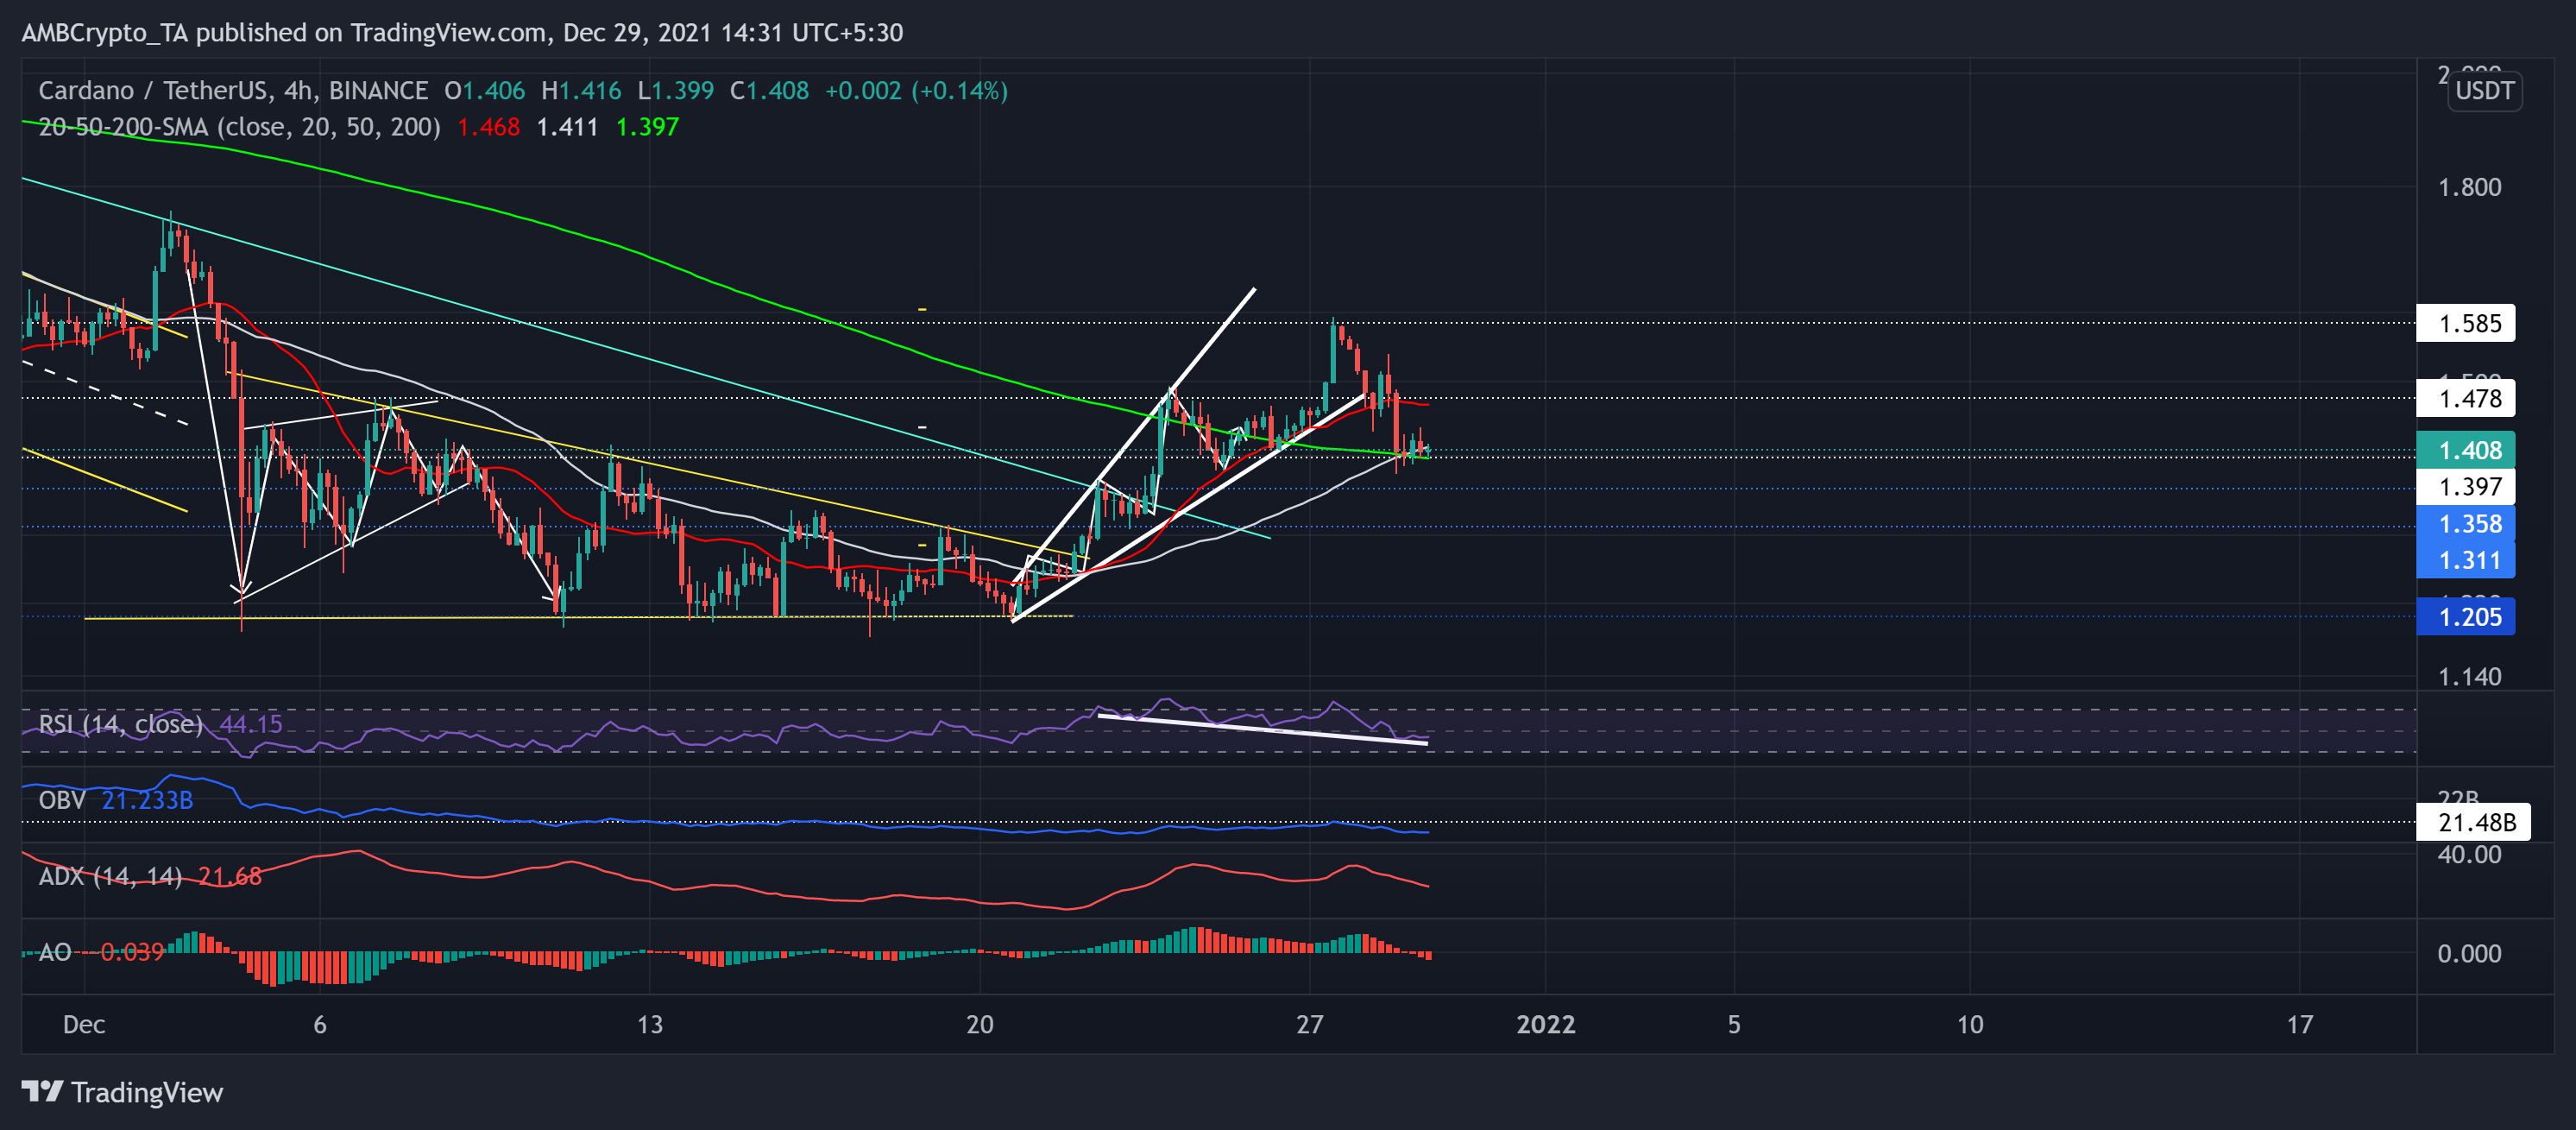
As we saw in the previous article, ADA continued to oscillate in an ascending broadening wedge (reversal pattern, white) after breaching the $1.47 resistance. The alt’s price action also snapped its long-term trendline resistance (Cyan, since 9 November).
Then, it saw an expected patterned breakdown from its month-long resistance at the $1.58-level. After touching its three-week high on 27 December, ADA retraced by nearly 11.56% in the last two days.
This fall found immediate support near the $1.39-level that coincided with the 50 SMA (grey) and 200 SMA (green). Regarding the strength of its recent downtrend, the OBV saw a sharp decline after touching its two-week high.
At press time, ADA traded at $1.408. The RSI skewed in favor of bears after consistently marking lower lows since the past week. However, The price action marked higher lows during this time, thus forming a bullish divergence between the two. While the AO depicted a shift in momentum in favor of bears, the ADX displayed a weak directional trend for ADA.
Polkadot (DOT)
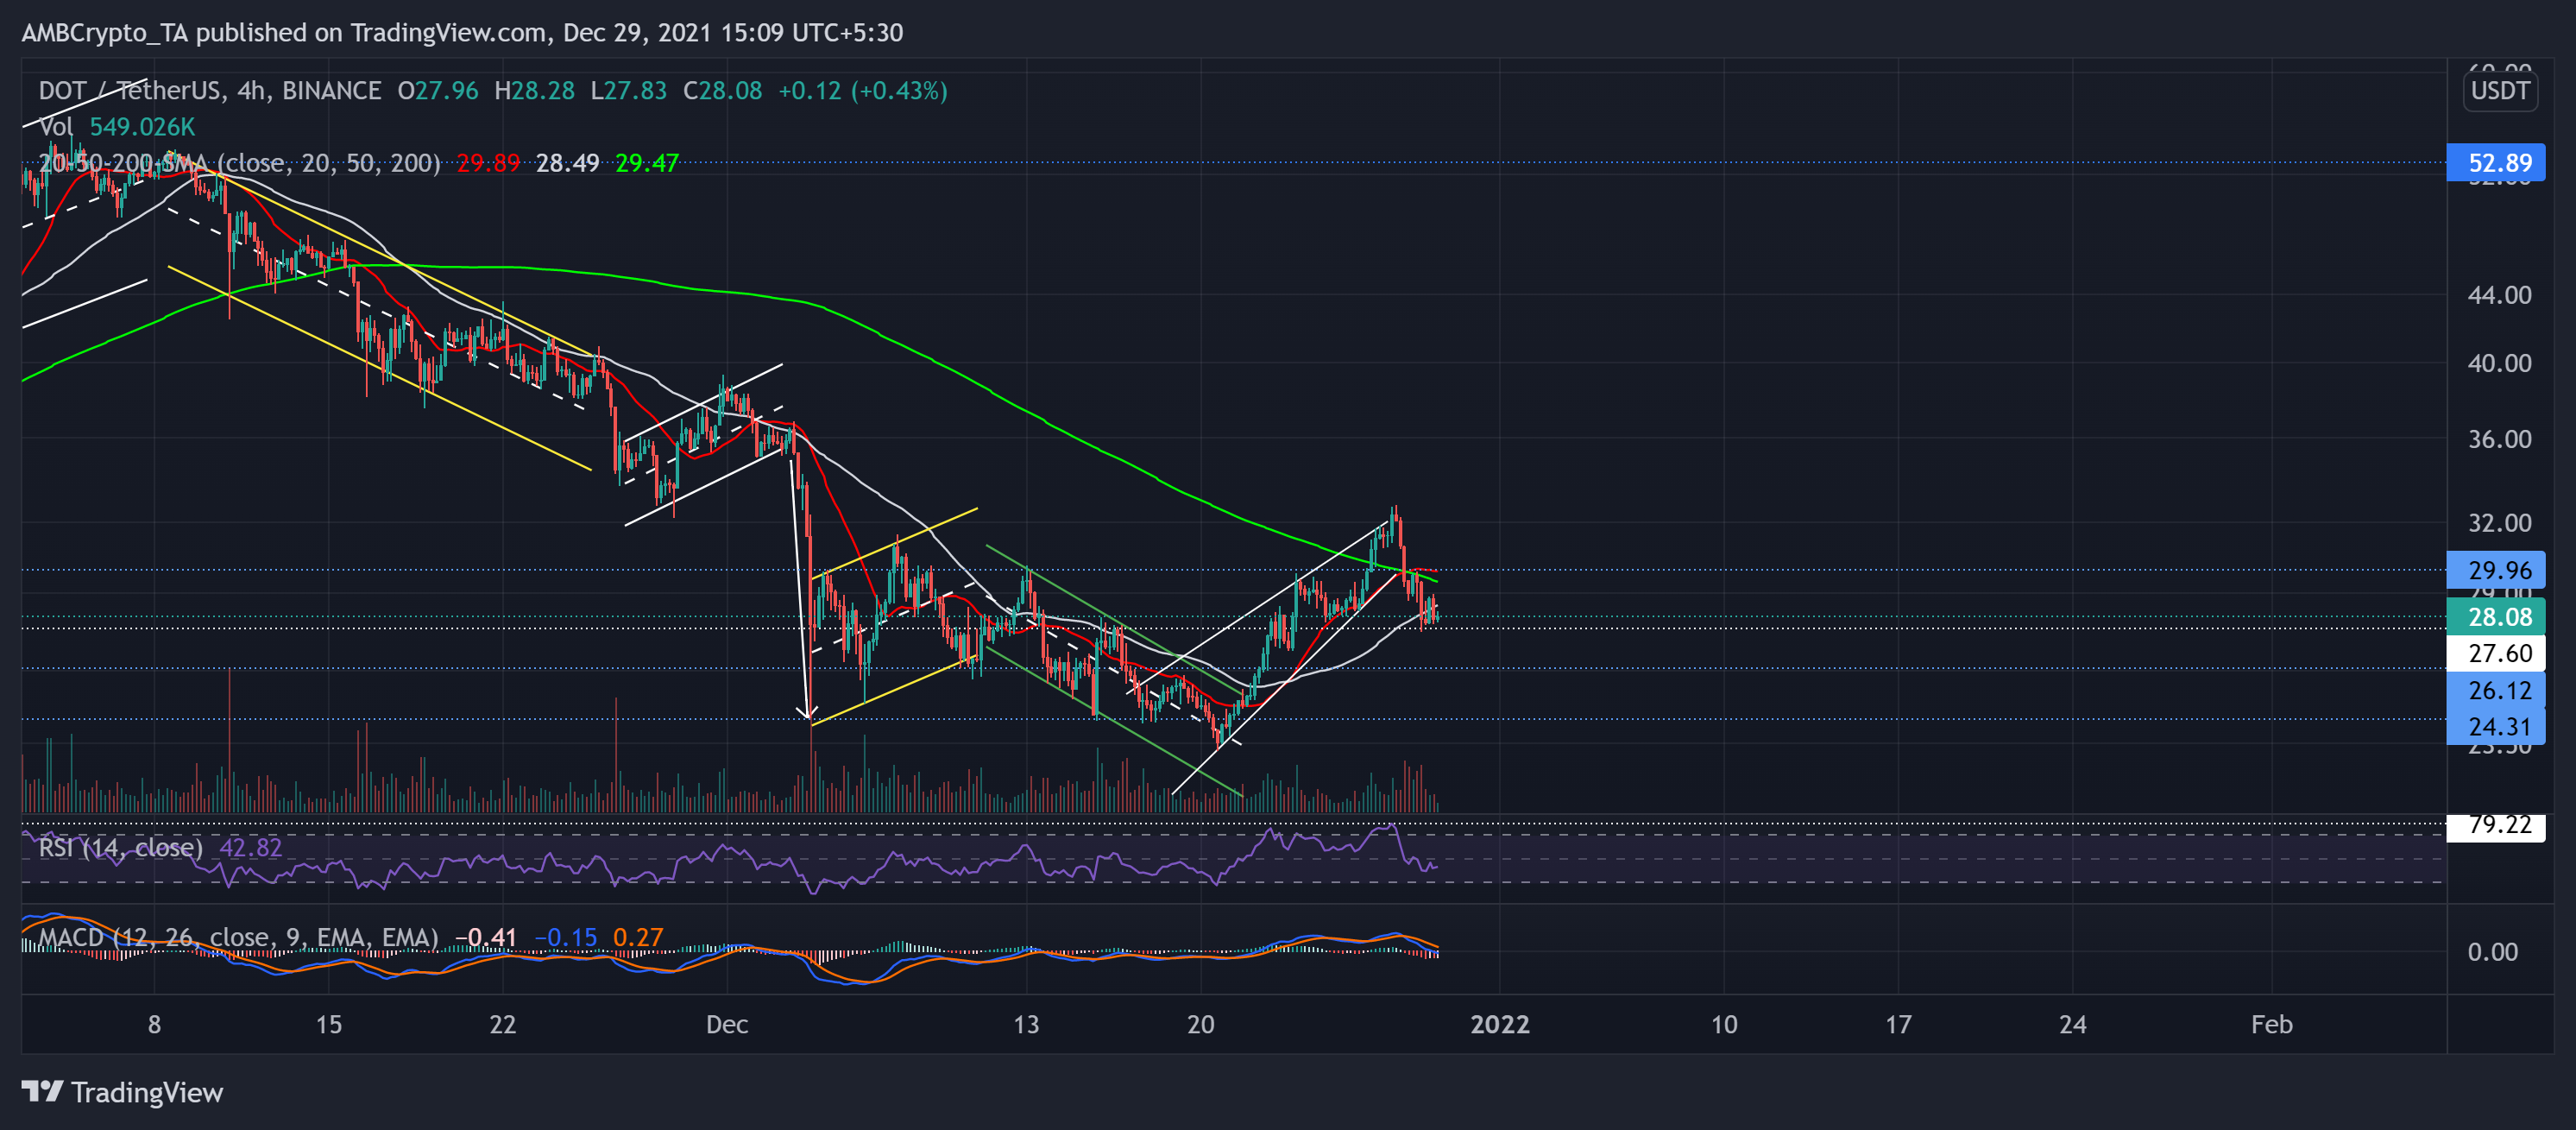
DOT noted an over 40% incline (from 20 December low) until it poked its three-week high on 27 December. Since then, it saw a 14.83% loss and witnessed a rising wedge breakdown in the last two days.
While the alt’s price dipped below its 20-50-200 SMA, it found immediate testing support at the $27.6-mark. However, the 20 SMA (red) managed to stay above the 200 SMA (green).
At press time, the alt traded at $28.08. The RSI saw a sharp plunge after poking its 21-week high and wavered near the 42-mark. The MACD line (blue) slumped below the equilibrium, indicating decreasing buying power. Further, the pullback volumes (red) were higher than the incline volumes, hinting at a decent sell-off situation.
Algorand (ALGO)

ALGO performed quite poorly after poking the $2.04-mark on 2 December. Then, the price action saw a substantial breakdown as it fell below the $1.84-mark.
As a result, after forming a bearish flag, it further broke down below the $1.39-mark (15-week resistance) in a down-channel (yellow). The coin saw a nearly 35.85% recovery (from the 20 December low) until it touched its three-week high on 27 December. Since then, it saw a 14.07% pullback below the $1.58-level.
At press time, ALGO traded at $1.4805. The RSI stood at the 40-mark after choosing the bears. Despite the price action marking newer lows, the OBV seemed to find strong near-term support, indicating that the buyers have not dwindled.