Can Bitcoin live up to the bull expectations over time as it enters 2022

There are many factors affecting Bitcoin’s price on long time horizons. The influence ranges from on-chain data to the macroeconomic state of developed economies, and the performance of traditional financial markets.
Bitcoin continues to be regarded as a speculative, risky asset, and investors are likely to flee BTC in risk-off market conditions. On the charts, Bitcoin traded just above the mid-point of a year-long range.
BTC — 1-day chart
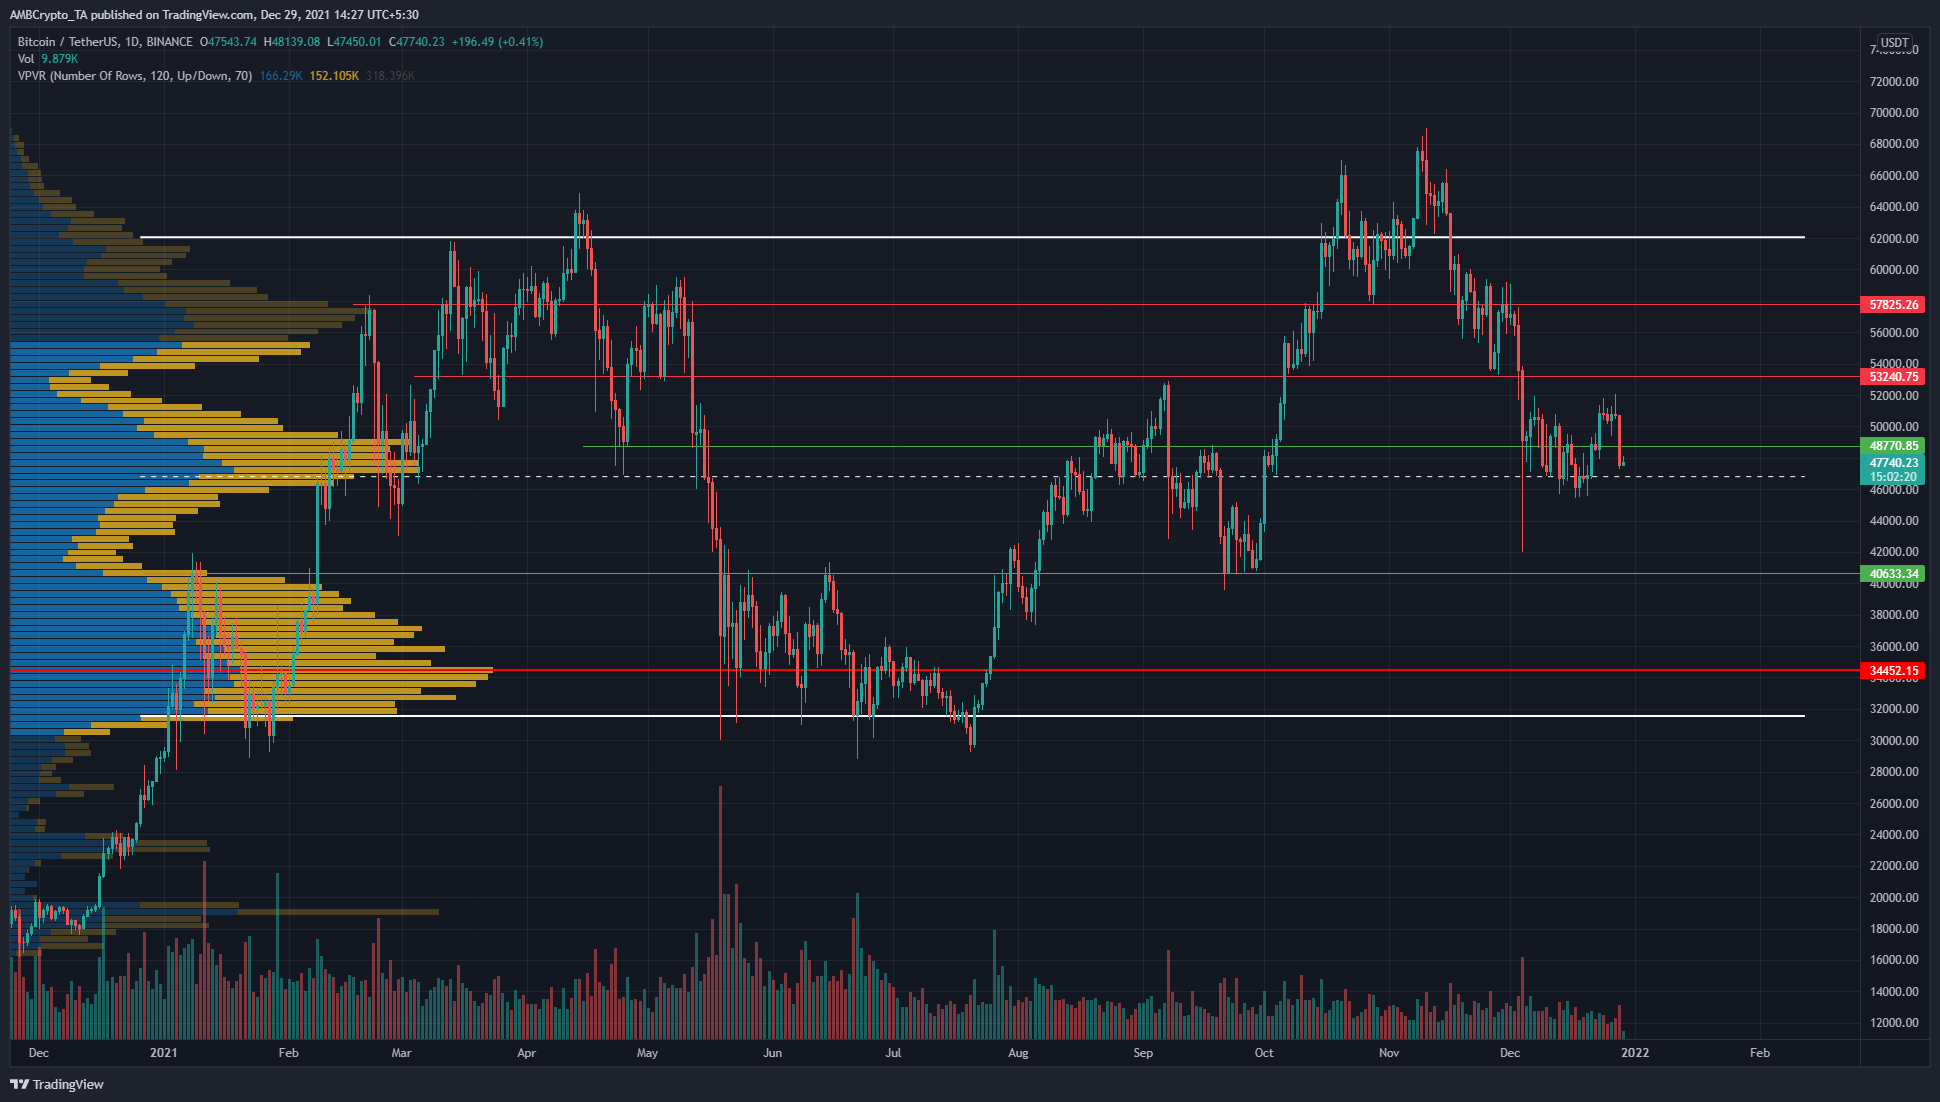
The range (white) has its highs and lows at $62k and $31.5k respectively. Deviations beyond either extreme were quick to reverse. At the time of writing, BTC was trading at $47.7k.
The Visible Range Volume Profile showed strong liquidity in the $46-50k area, some more in the $56-$58.6k area, and the strongest of all in the $32.8k-$40k area. It also showed some gaps, places where BTC could quickly punch past due to lack of significant price activity.
One of these was the $40k-$43k, and another the $51.3k-$53.3k area. On its most recent try, BTC was unable to scale the $51.3k heights convincingly and slipped after a wick to $52k. This brought it once more to the mid-range support at $46.8k. Price always seeks liquidity, and BTC was already within an area, where buyers and sellers, both are contesting.
Rationale
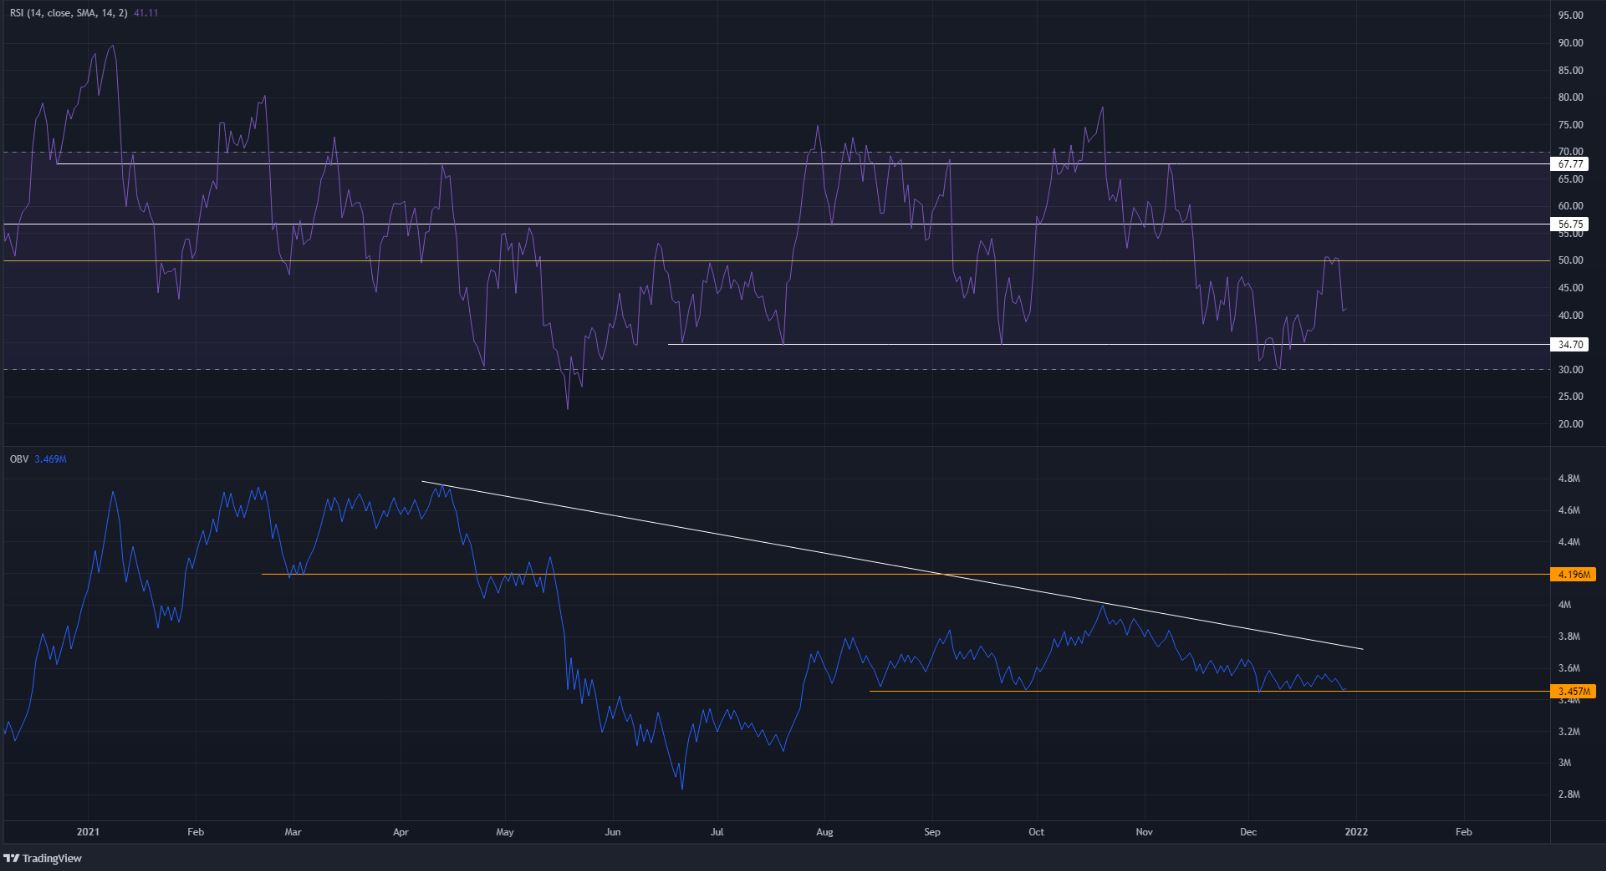
The RSI showed bulls were unable to flip the momentum, as the neutral 50 acted as resistance. A move below 34.7 on the RSI has seen Bitcoin plunge, while a move past 56.75 has seen BTC climb rapidly.
The OBV showed that May’s highs are far out of reach, but the OBV has held on to a level since mid-August. The number doesn’t matter, but if BTC plunges beneath this level, it would indicate sellers have gained the upper hand and could force BTC lower.
Conclusion
The indicators showed selling has been prevalent over the past few months. The price stood at an area where buyers have been strong in the past. A dip beneath $45.8k on the daily could take BTC quickly to $40k, the bearish scenario.
The bullish scenario (long time horizon) would be sellers getting exhausted in this demand region and the buyers driving the price to the next area of significance, that is, $57.8k. A flip of that level, to support, in the coming months could see BTC challenge its ATH once more.


