A look into what’s holding back Uniswap’s long-overdue rally

The past few months have been quite mundane for Uniswap. This DeFi token last witnessed a proper rally back in July-August. Over that period, notably, its price surged by more than 120% on the charts.
However, that didn’t last long. Since its honeymoon phase passed, UNI has either fallen on the charts or traded horizontally on the same.

The larger gloomy picture
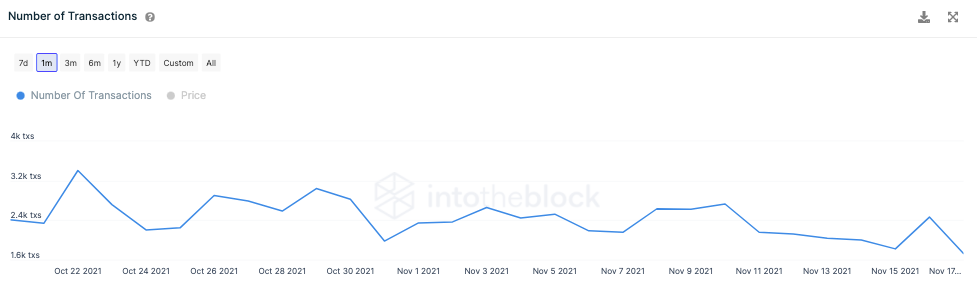
As expected, most of Uniswap’s metrics have been exhibiting bearish market trends. Market participants’ interest with respect to this token is far from brewing. In fact, the state of the transaction count metric supported the aforementioned claim.
This metric has been hovering around its lows for quite a few weeks now, but the state of the same became even worse on 10 November. Consequently, the number of transactions was seen revolving at its multi-month low of 1.73k at press time.
The selling pressure has additionally gotten more intense over the last few days. And, the same was highlighted by two indicators – Average balance and trades per side.
On 10 November, the mean value of the tokens held by an address stood at $101k. However, at the time of writing, the same was seen oscillating around $78k. Furthermore, as per the order book’s stats, over 74k additional UNI tokens were sold than bought in the three hours before press time alone. This was a sign of pessimistic market sentiment.
To make things even more slippery for UNI, the turnover ratio [that gauges the OI and volume] has flattened over the past few days. This, again, highlighted deficient momentum in the market.
Keys to the lock
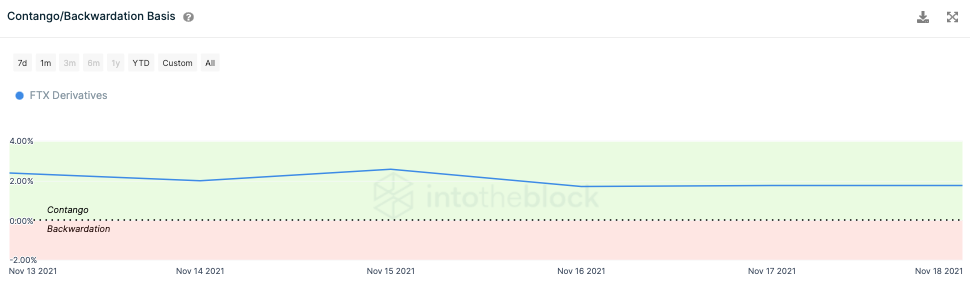
FTX Derivatives’ forward curve, however, projected a contradictory trend. Now, as can be observed from the chart attached, the market has been in Contango over the past week.
Contango is a situation where the Futures price of an asset is higher than its spot price. The same usually occurs when the underlying asset’s price is expected to rise over time.
When viewed carefully, it can be noted that the curve did bend slightly south post 15 November. However, it has steadily been able to maintain its position around the 2% mark.
Thus, as long as this curve doesn’t slip into backwardation, derivatives traders do have the potential to change things for Uniswap.
DeFi tokens usually rise and fall in value together on the charts. Of late, tokens like AAVE, MKR, and YFI have started getting out of their shells. Subsequently, they were trading in the green, at the time of writing, after witnessing a red week together.
Thus, if this surge proves to be consistent, UNI’s boat might finally find wind, despite the current state of its metrics.