A trend reversal for Bitcoin will be inevitable if…

The volatility squeeze on Bitcoin’s charts has kept the market’s largest cryptocurrency in the news of late. Over the last 24 hours, however, another key metric flashed something intriguing. Possibly, Bitcoin’s price could substantially change its course over the next few weeks.
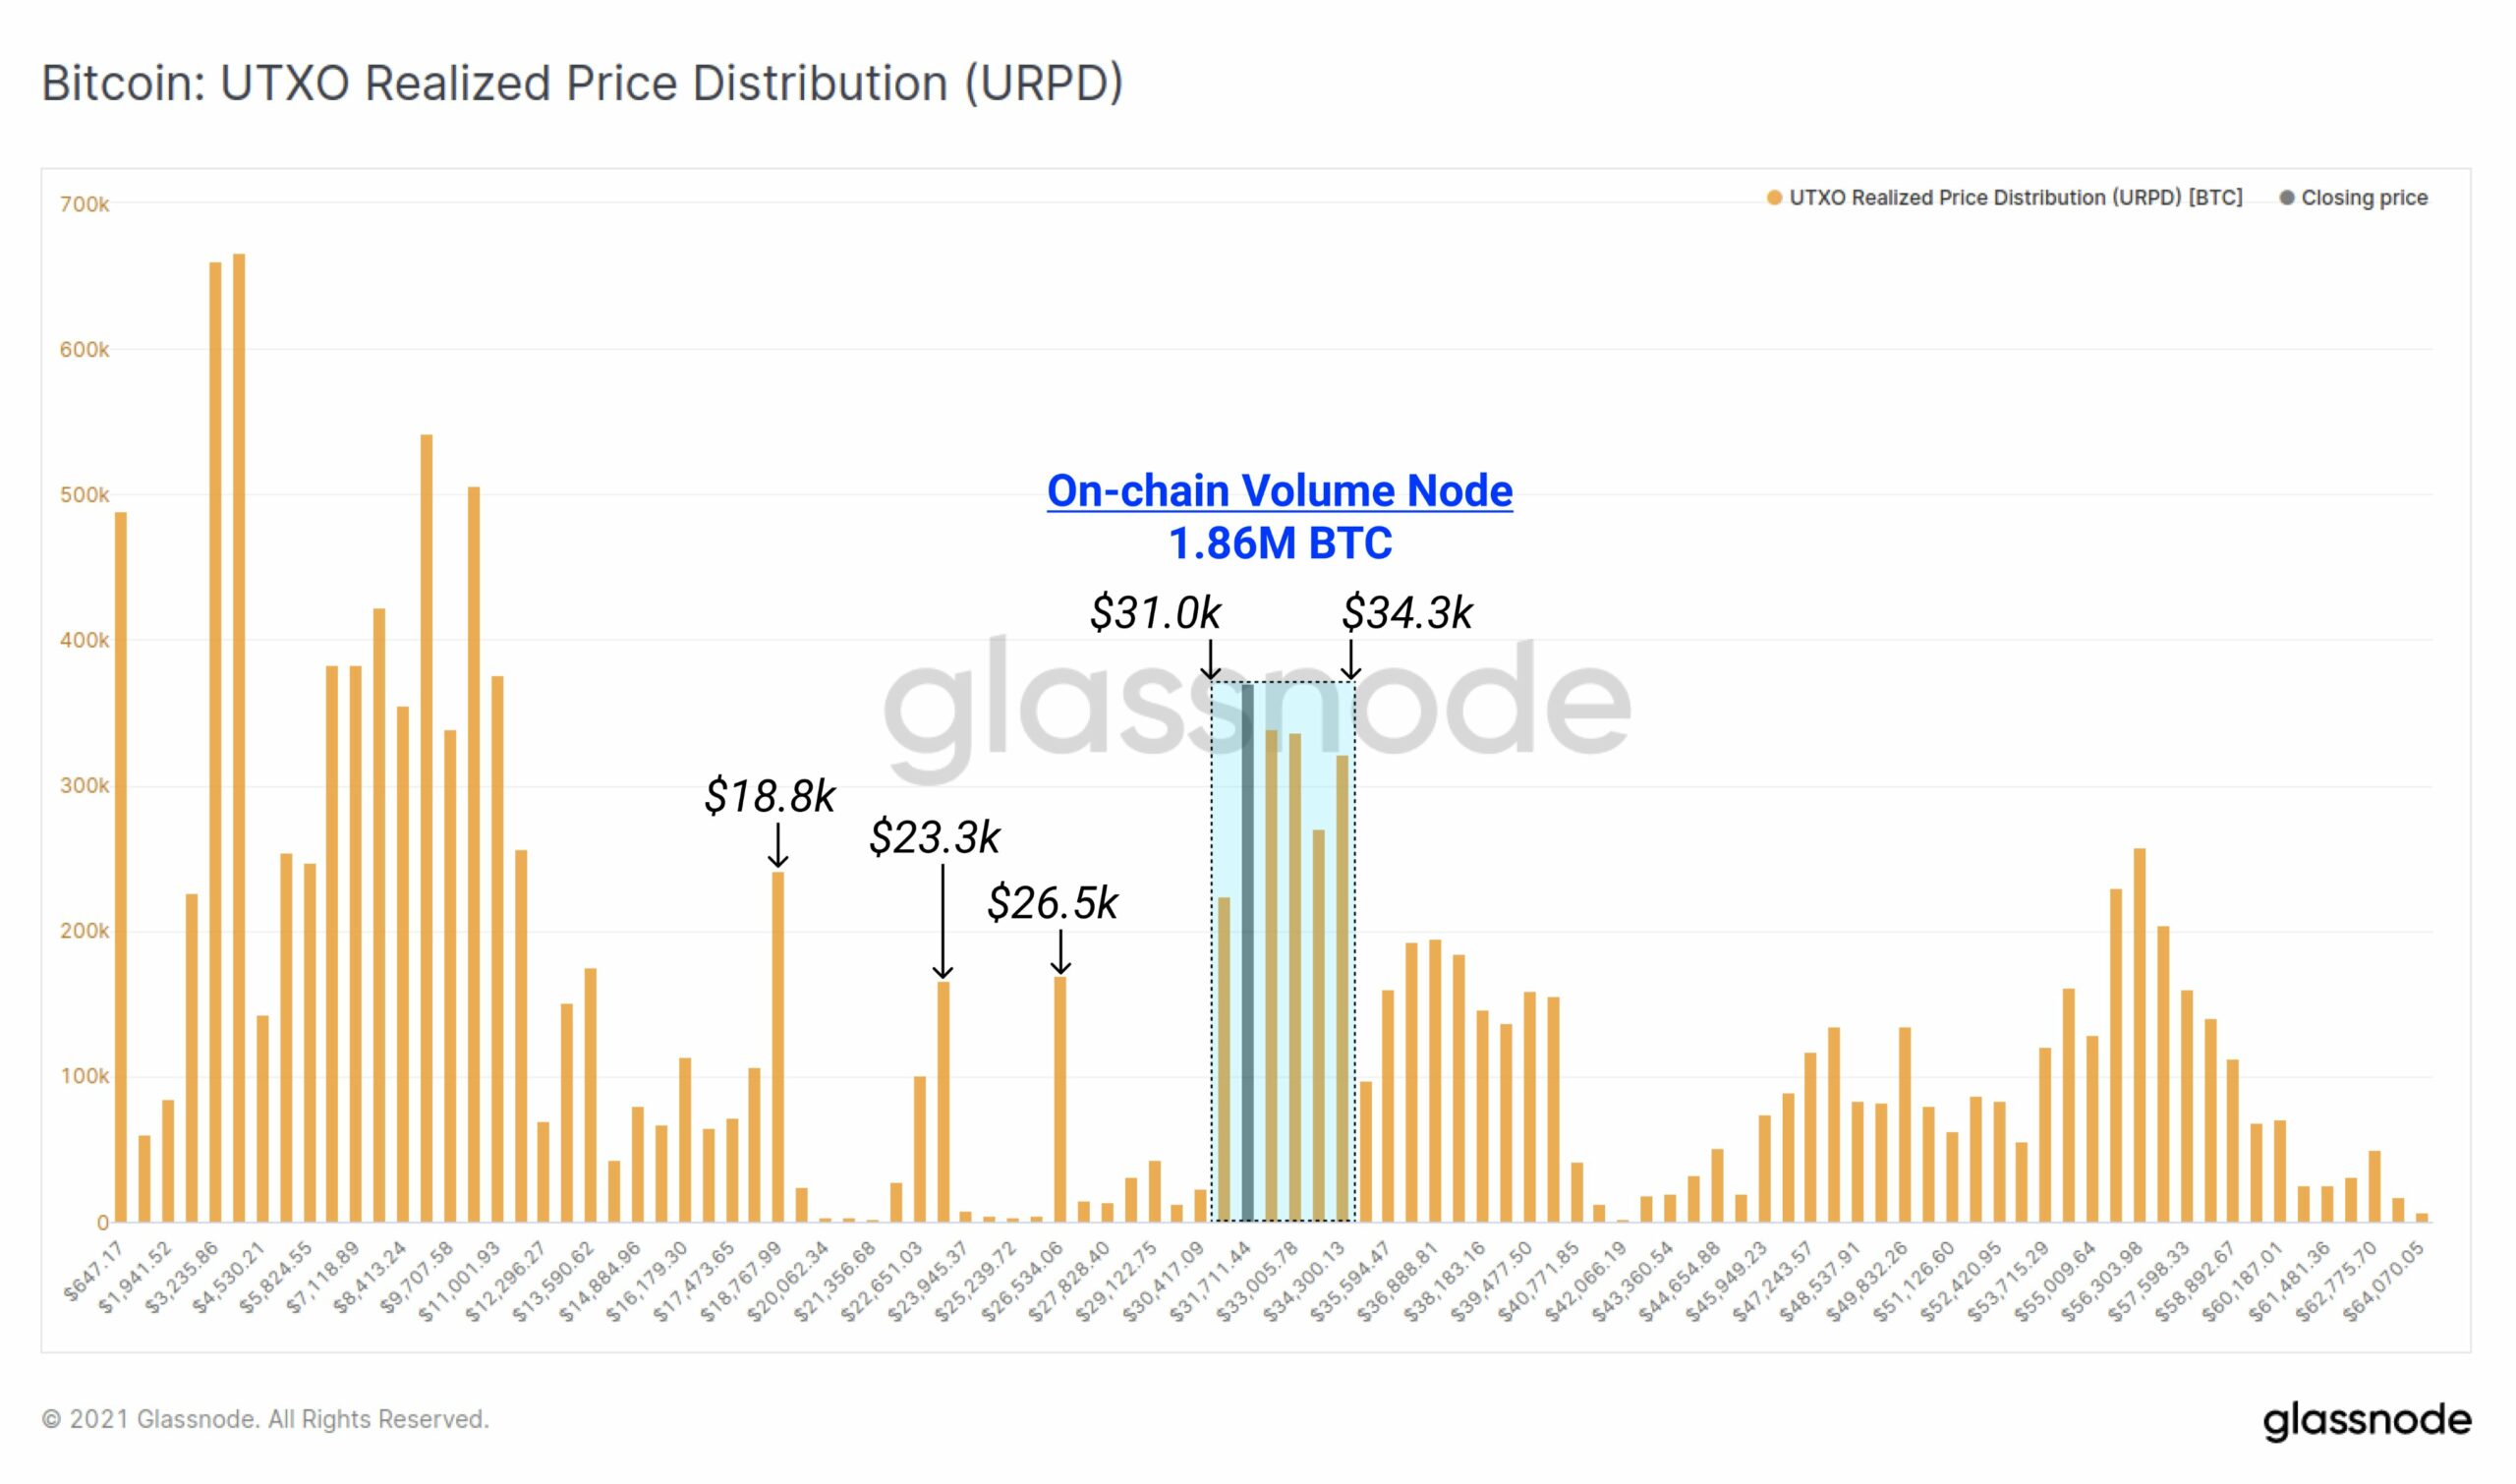
Bitcoin, at the time of writing, was trading near the lows of a key on-chain volume node, with the same highlighted by the UTXO Realised Price Distribution chart. This indicator revealed the price at which the current set of Bitcoin UTXOs was created. In other words, each bar on the chart showed the amount of existing Bitcoin that last moved within that specified price level.
Now, between the price levels of $31k and $34.3k, over 1.86 million Bitcoin had been transacted on-chain. Notably, that amounts to 9.93% of Bitcoin’s circulating supply, and that figure is quite substantial. As depicted in the chart attached, this is convincingly the largest realized volume cluster after $12k.
When close to one-tenth of BTC’s supply moves at that level, a handful of reasonable assumptions can be made. For starters, it indicates that this range has endured a heavily concentrated cost basis. The trend also explains why Bitcoin is currently experiencing strong support at various levels in the aforementioned price band. However, it should be noted that the support could translate itself into an overheated resistance level too if lost.
Also, whenever large volumes of coins are transacted in congested zones, like what is happening now, it is a sign that a considerable number of market participants have sold their holdings. Parallelly, it should also be kept in mind that other participants bought those coins at the same price level. Ultimately, buying interest still exists in the Bitcoin market.
The price coiling up into a small range for a long period, again, most likely indicates that a big move is on the cards. Nevertheless, without raising the bar too high, one of the following scenarios could unfold itself over the next few days.
One, if Bitcoin starts trading higher, investors would cash out to relish their profits earned. Now, that would mean a weak conviction to HODL, which is ultimately not a great sign. Next, if Bitcoin’s price stumbles a little further and market participants start dumping, Bitcoin’s price would again get negatively affected.
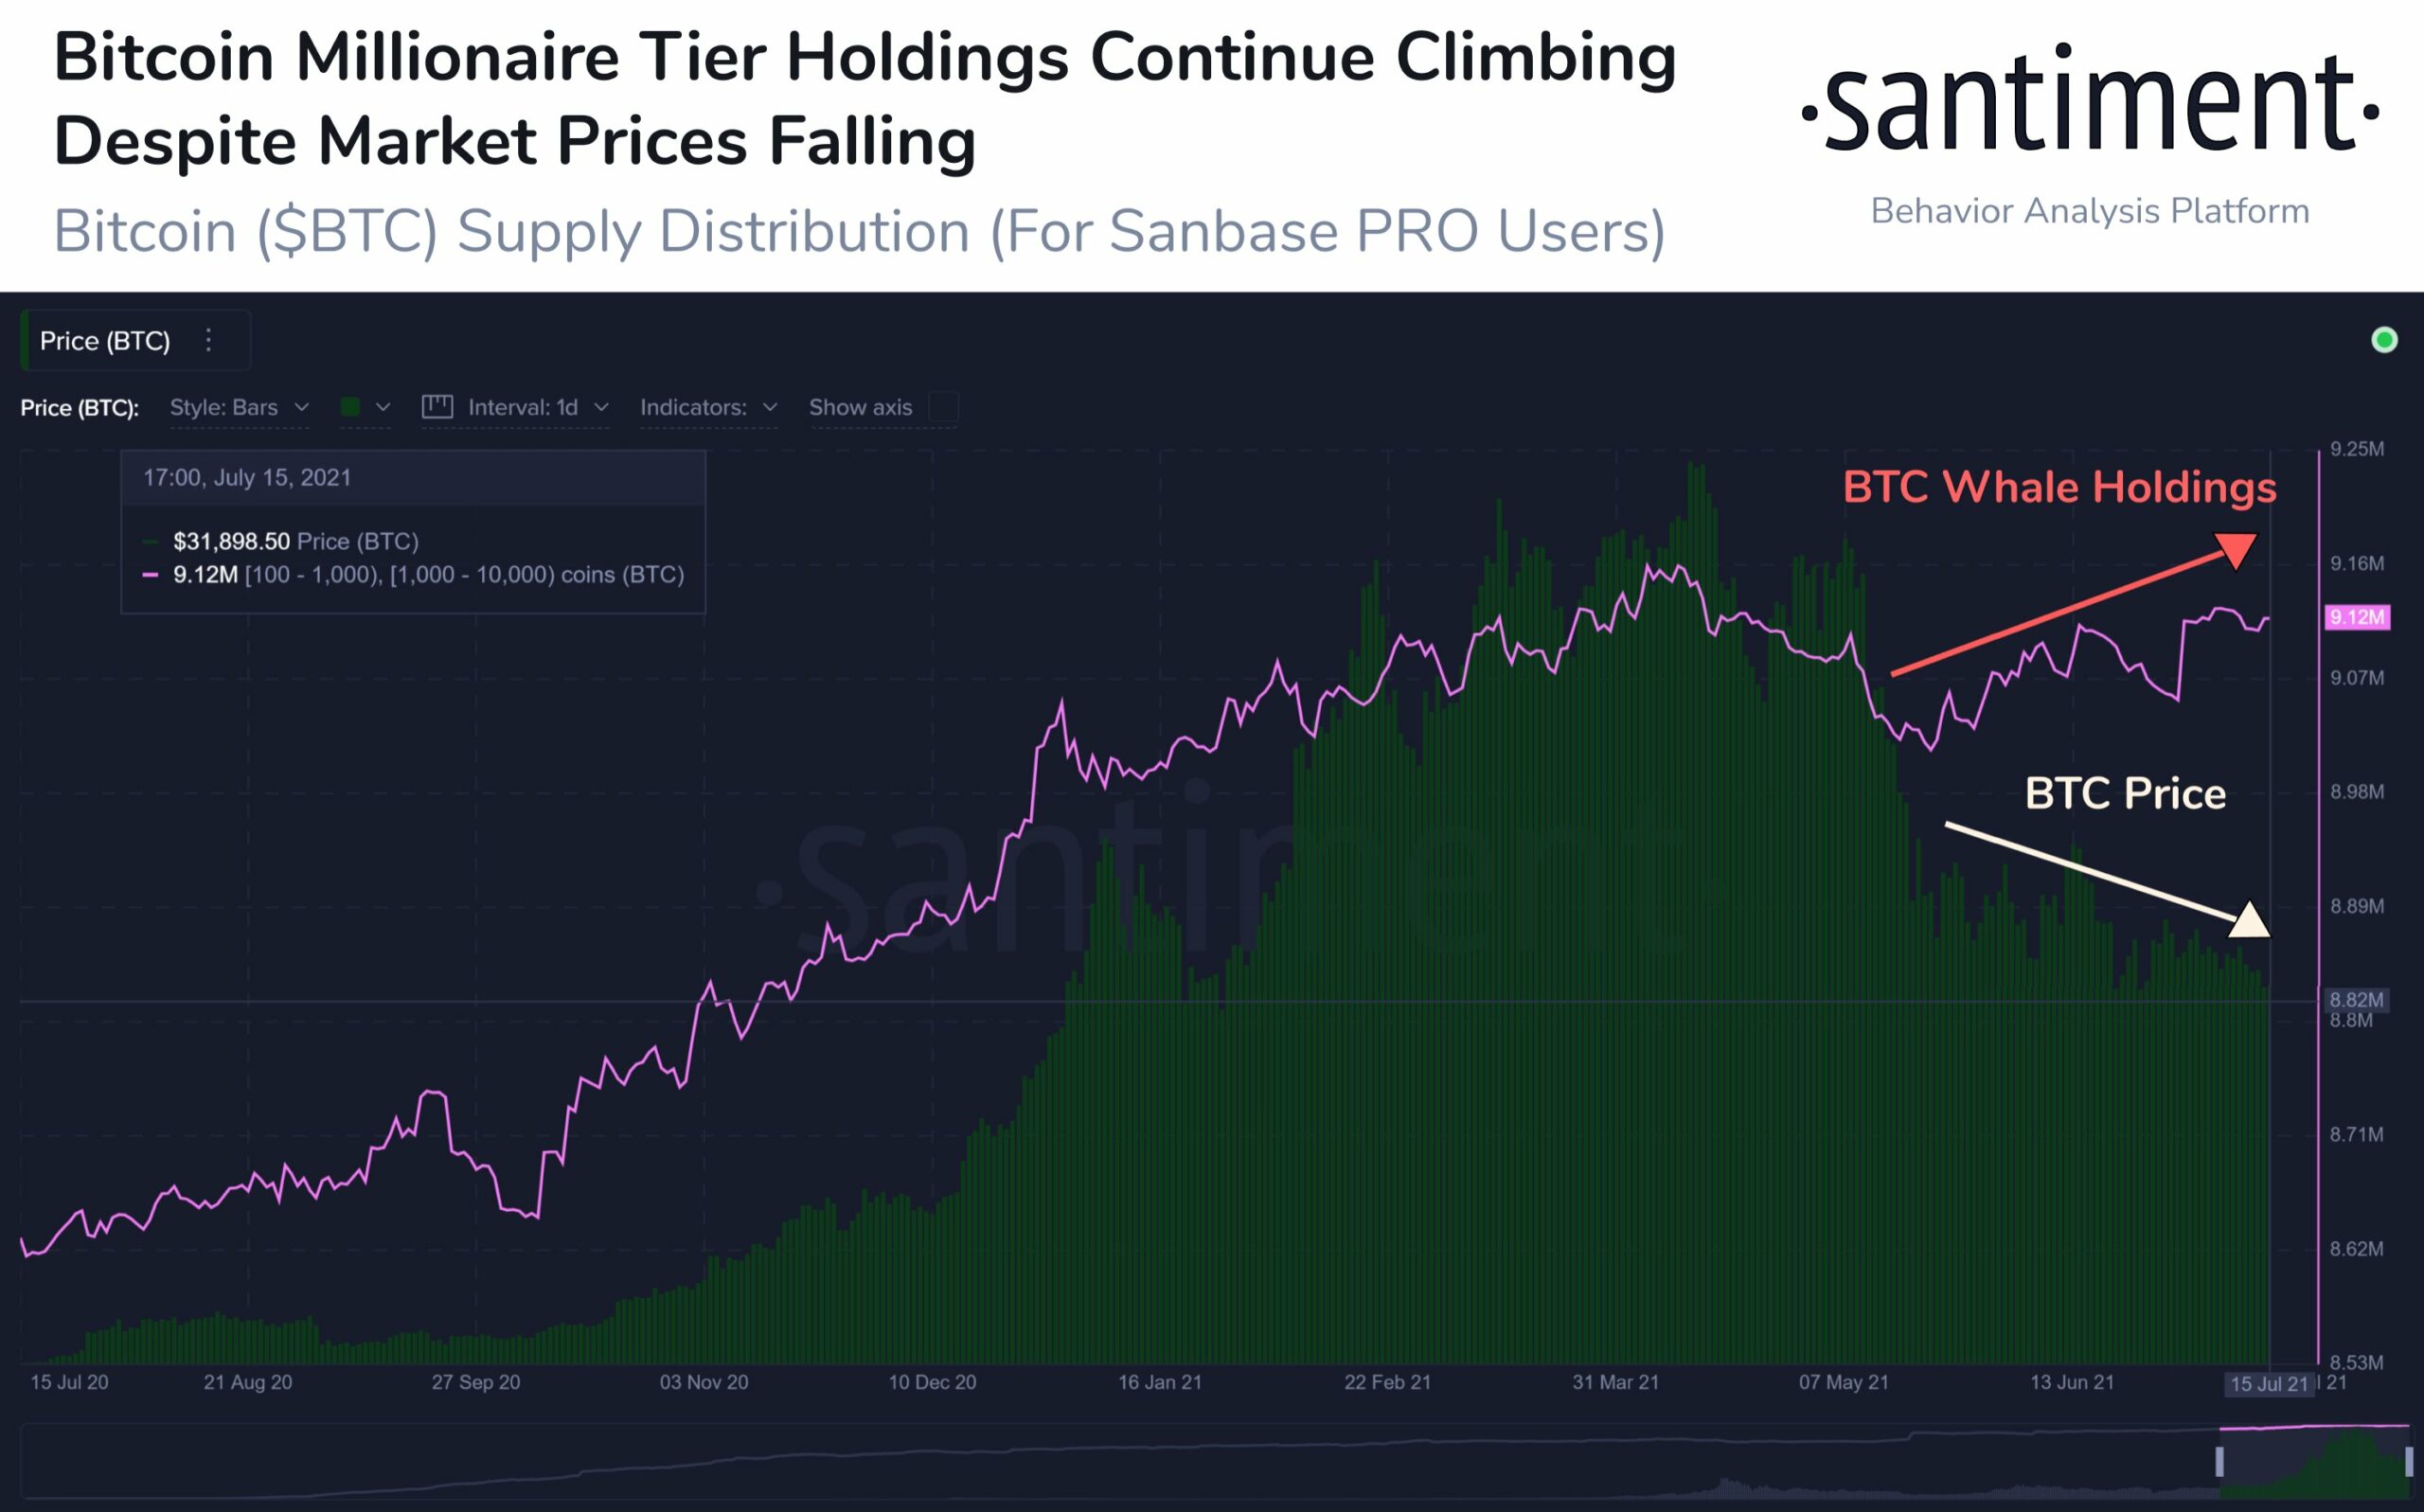
However, irrespective of the price change direction, if investors continue to HODL, the odds of the bearish narrative getting gradually wiped out would intensify. Well, the chances of this situation unfolding itself seems to be most likely at the moment because the ‘millionaire tier’ HODLings were rising, despite the price dwindling. The same trend was highlighted by a recent Santiment tweet.
Keeping other assumptions aside, one thing is sure for now. Coins are changing hands and are moving from weak to strong hands. If the aforementioned trend continues in the same direction, Bitcoin’s price trend reversal would become almost inevitable.


