
There was some on-chain sign of a move toward $450 for Aave based on the concentration of large wallets. On the charts, the medium-term outlook was neutral but climbing above $360 would be a sign of bullish strength. Cosmos also faced strong resistance at $19.8, and Monero was consolidating above a level of support at $215.
Aave [AAVE]
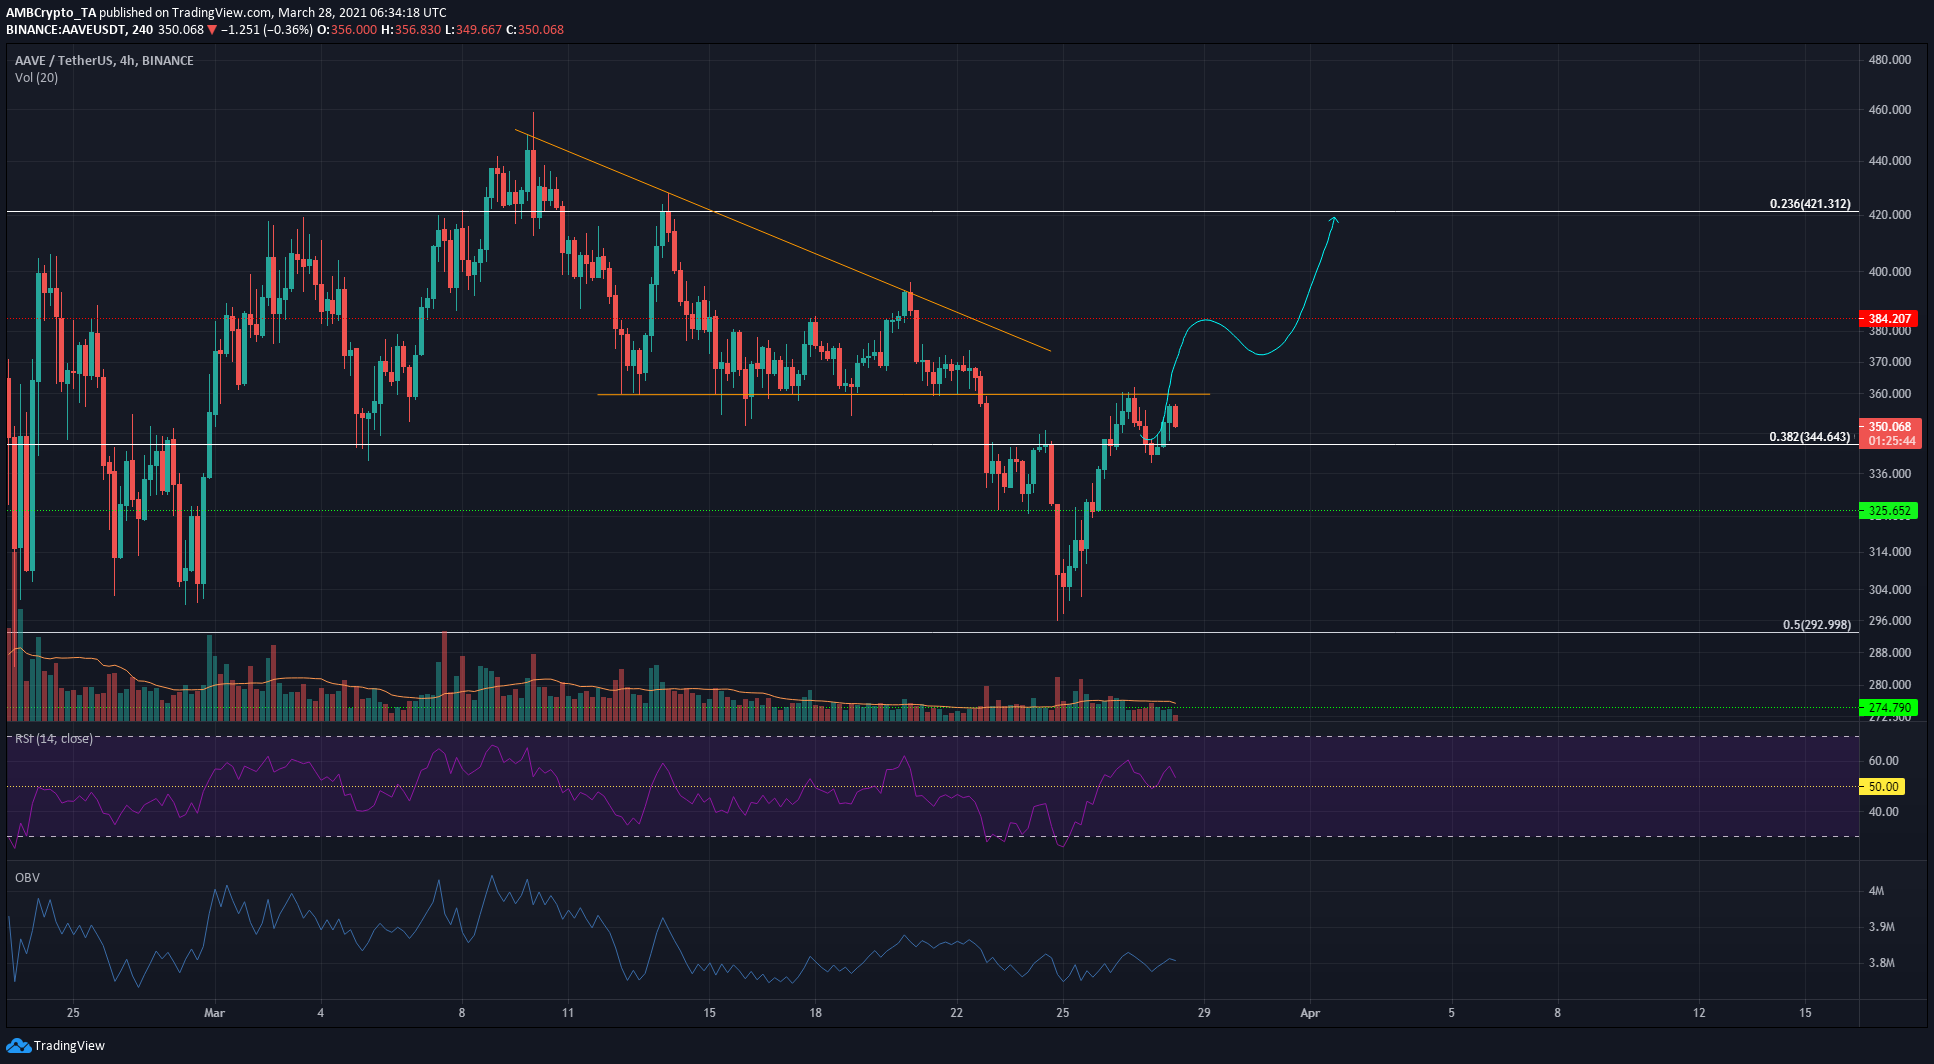
Source: AAVE/USDT on TradingView
A previous analysis noted a bullish scenario for AAVE (in cyan). The $340 mark has been defended; $344 has not been ceded to the bears. Resistance at $360 hasn’t yet been overcome either, but it could be. RSI was above neutral 50, but neither this nor the recent buying volume on OBV were strong evidence of an upward move.
Closing beneath $340 will invalidate the bullish scenario laid out for AAVE, and will likely see $325 and $300 revisited as support.
Cosmos [ATOM]
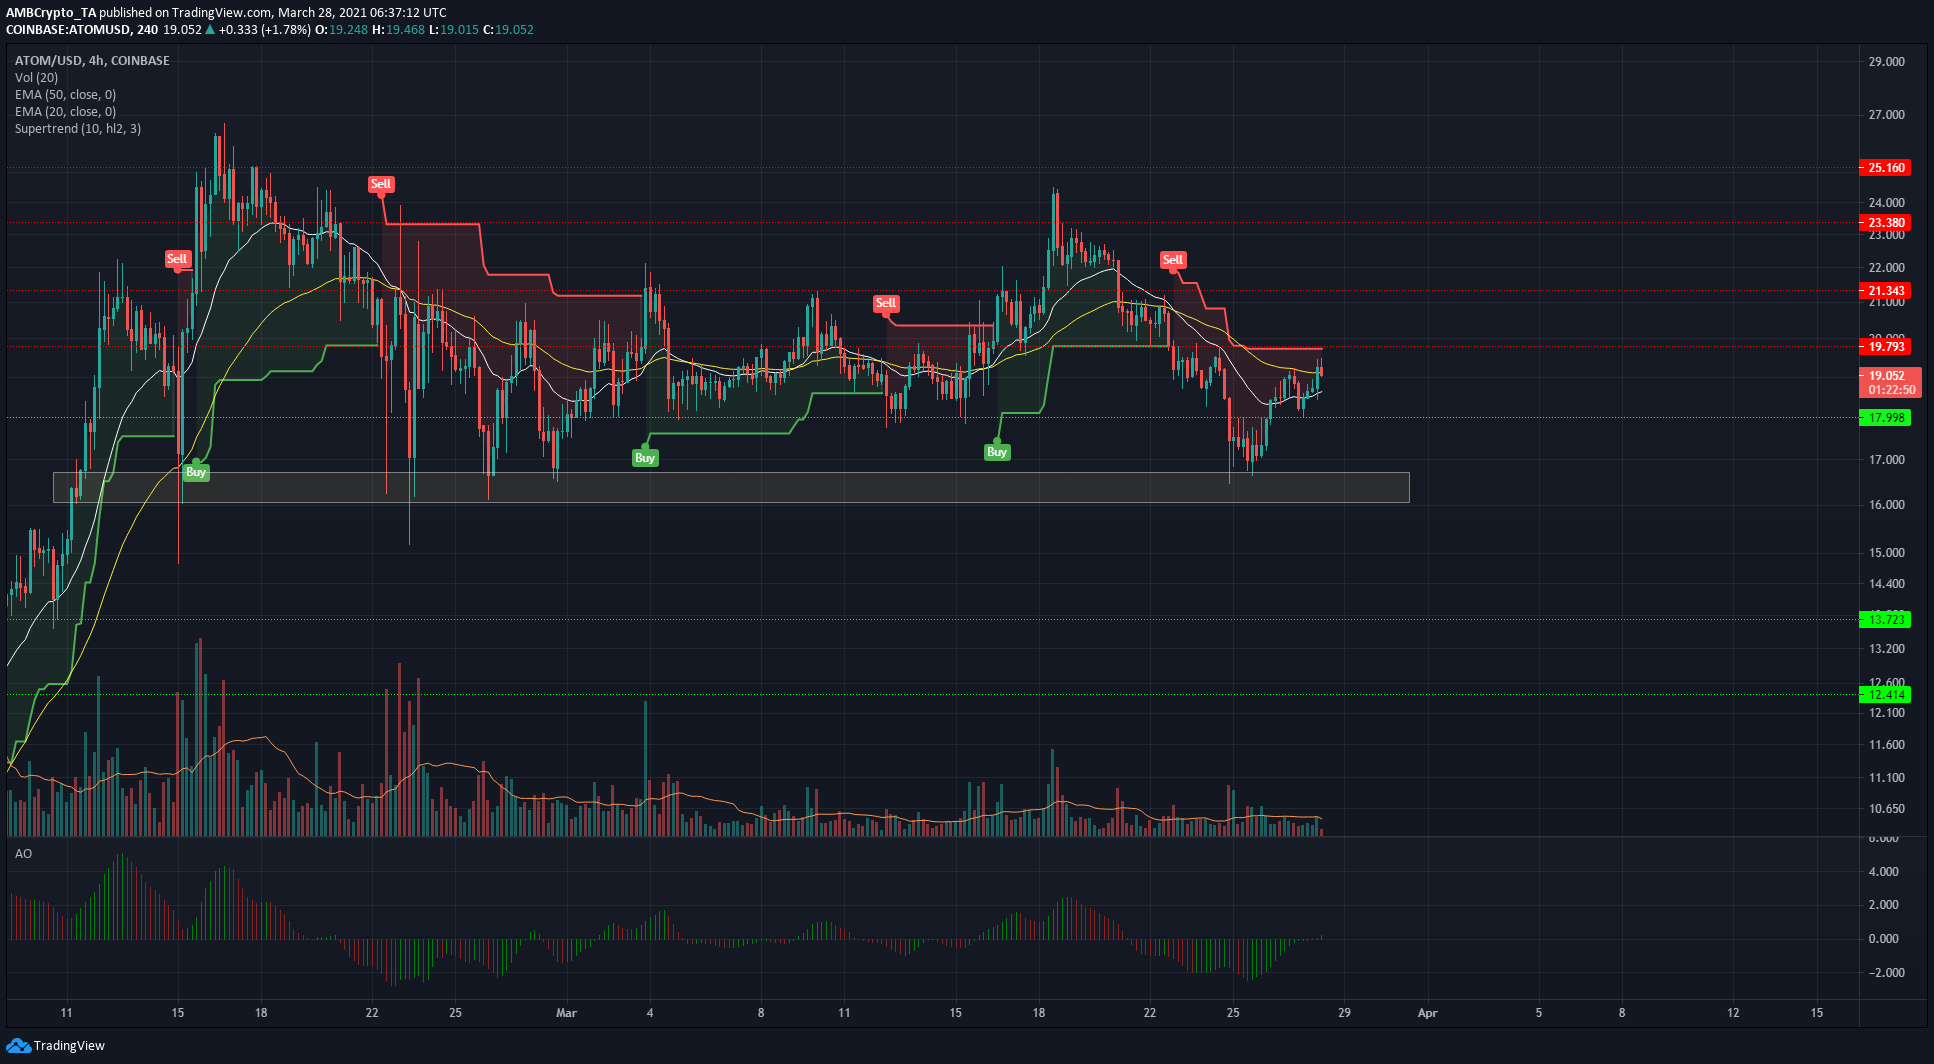
Source: ATOM/USD on TradingView
Awesome Oscillator crossed over above the zero line, following ATOM’s bounce off the $16 region of demand and the subsequent flip of $18 from resistance to support.
The 20-period EMA (white) was moving beneath the 50 EMA (yellow) to highlight recent bearish pressure. A climb above the $19.8 level could see a move to test the $21.3 resistance level.
Supertrend Indicator highlighted the $19.8 resistance level as a point where it would flip from signalling a short, to signalling a long.
Monero [XMR]
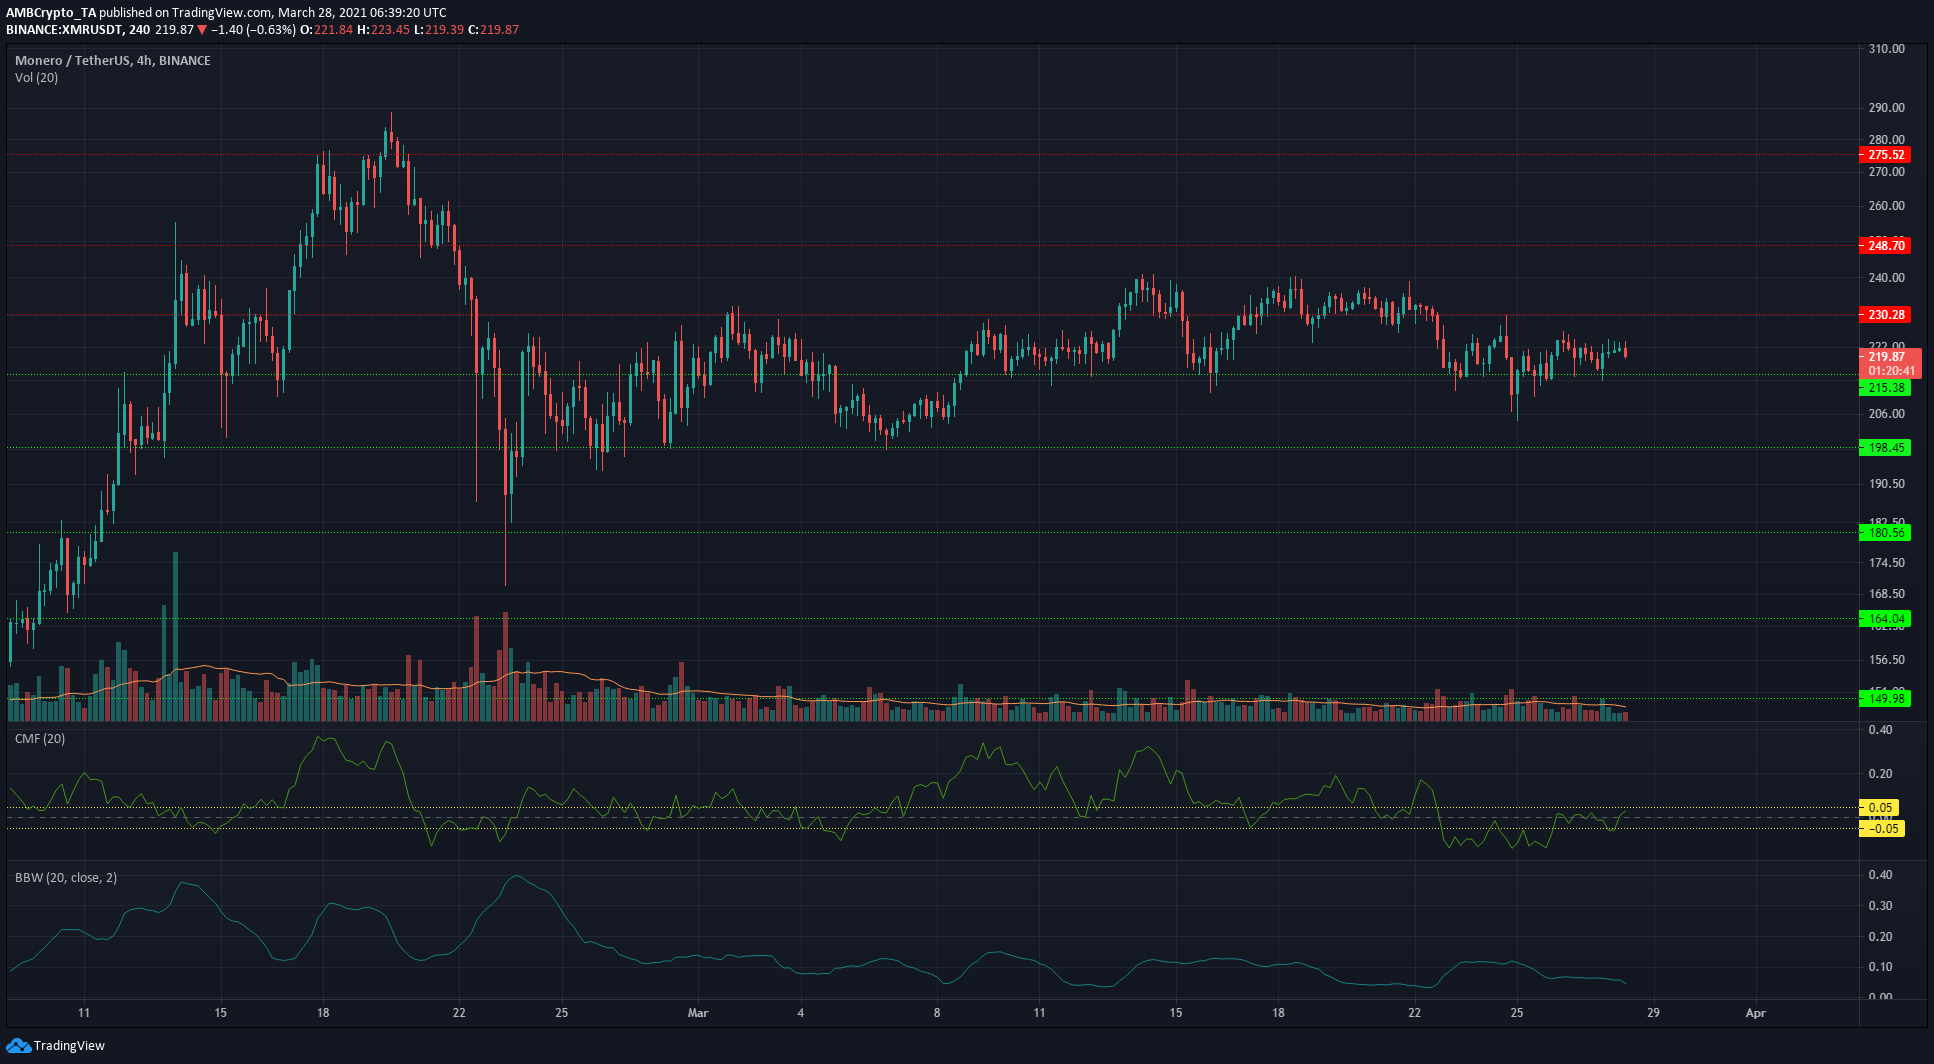
Source: XMR/USDT on TradingView
Monero was once more consolidating above the $215 level of support, with frequent candlewicks up as high as $224. For long-term traders, the $200-$230 area presents an accumulation opportunity.
On the 4-hour charts, Bollinger bands width was decreasing once more while Chaikin Money Flow in neutral territory, showing that neither buyers nor sellers were in control of the market.
For scalp-trading, volatility was present but came with its own risks.
The shorter-timeframes showed some evidence of bearish momentum and a move back to $215. Hence, the $213-$215 area could be used to enter scalp longs, with a stop-loss at $212.4 and a take-profit at $223.8.