AAVE traders can have this entry, exit, target price for their next trade

Disclaimer: The information presented does not constitute financial, investment, trading, or other types of advice and is solely the opinion of the writer.
Bitcoin has faced some resistance in the $21.6k-$21.8k area in the past week and was trading just beneath this resistance at the time of writing. Even though Bitcoin struggled to break the resistance barriers, AAVE faced no issues in doing so over the past week. In fact, the coin has posted gains of just over 60% within the past week.
The bullish structure of AAVE was apparent on the charts, and further upside could be seen in the coming days.
AAVE- 4-Hour Chart
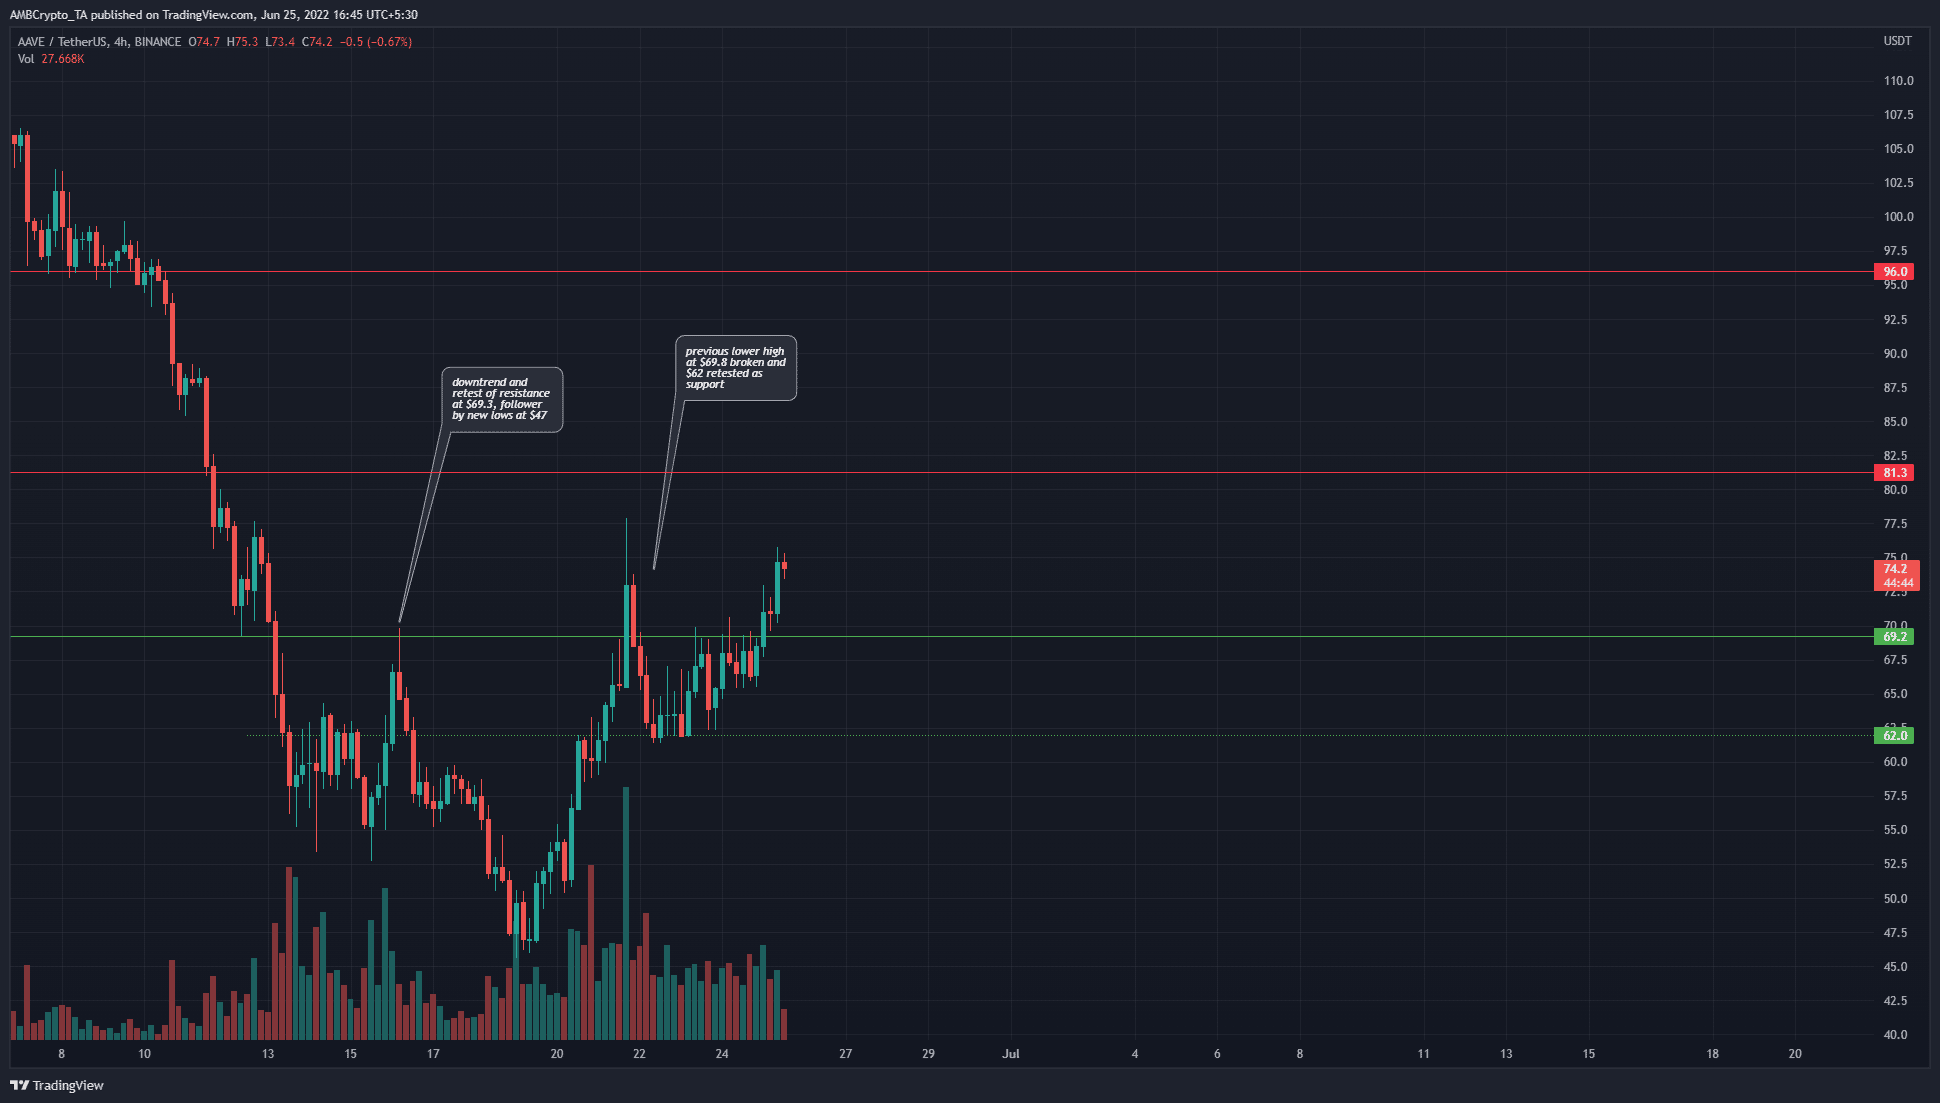
The four-hour AAVE chart showed an asset in rapid decline earlier this month as AAVE tumbled lower from the $96 level to drop as low as $47. In the past week, the price has broken past the $69.8 mark, which was the recent lower high of the larger downtrend.
This indicated a market structure break away from bearish. Moreover, the price also formed higher lows at $62 and flipped the level to support. Therefore, the bias over the next few days would be bullish. The $62 level would need to be broken again to flip the bias to bearish.
AAVE- 1 Hour Chart
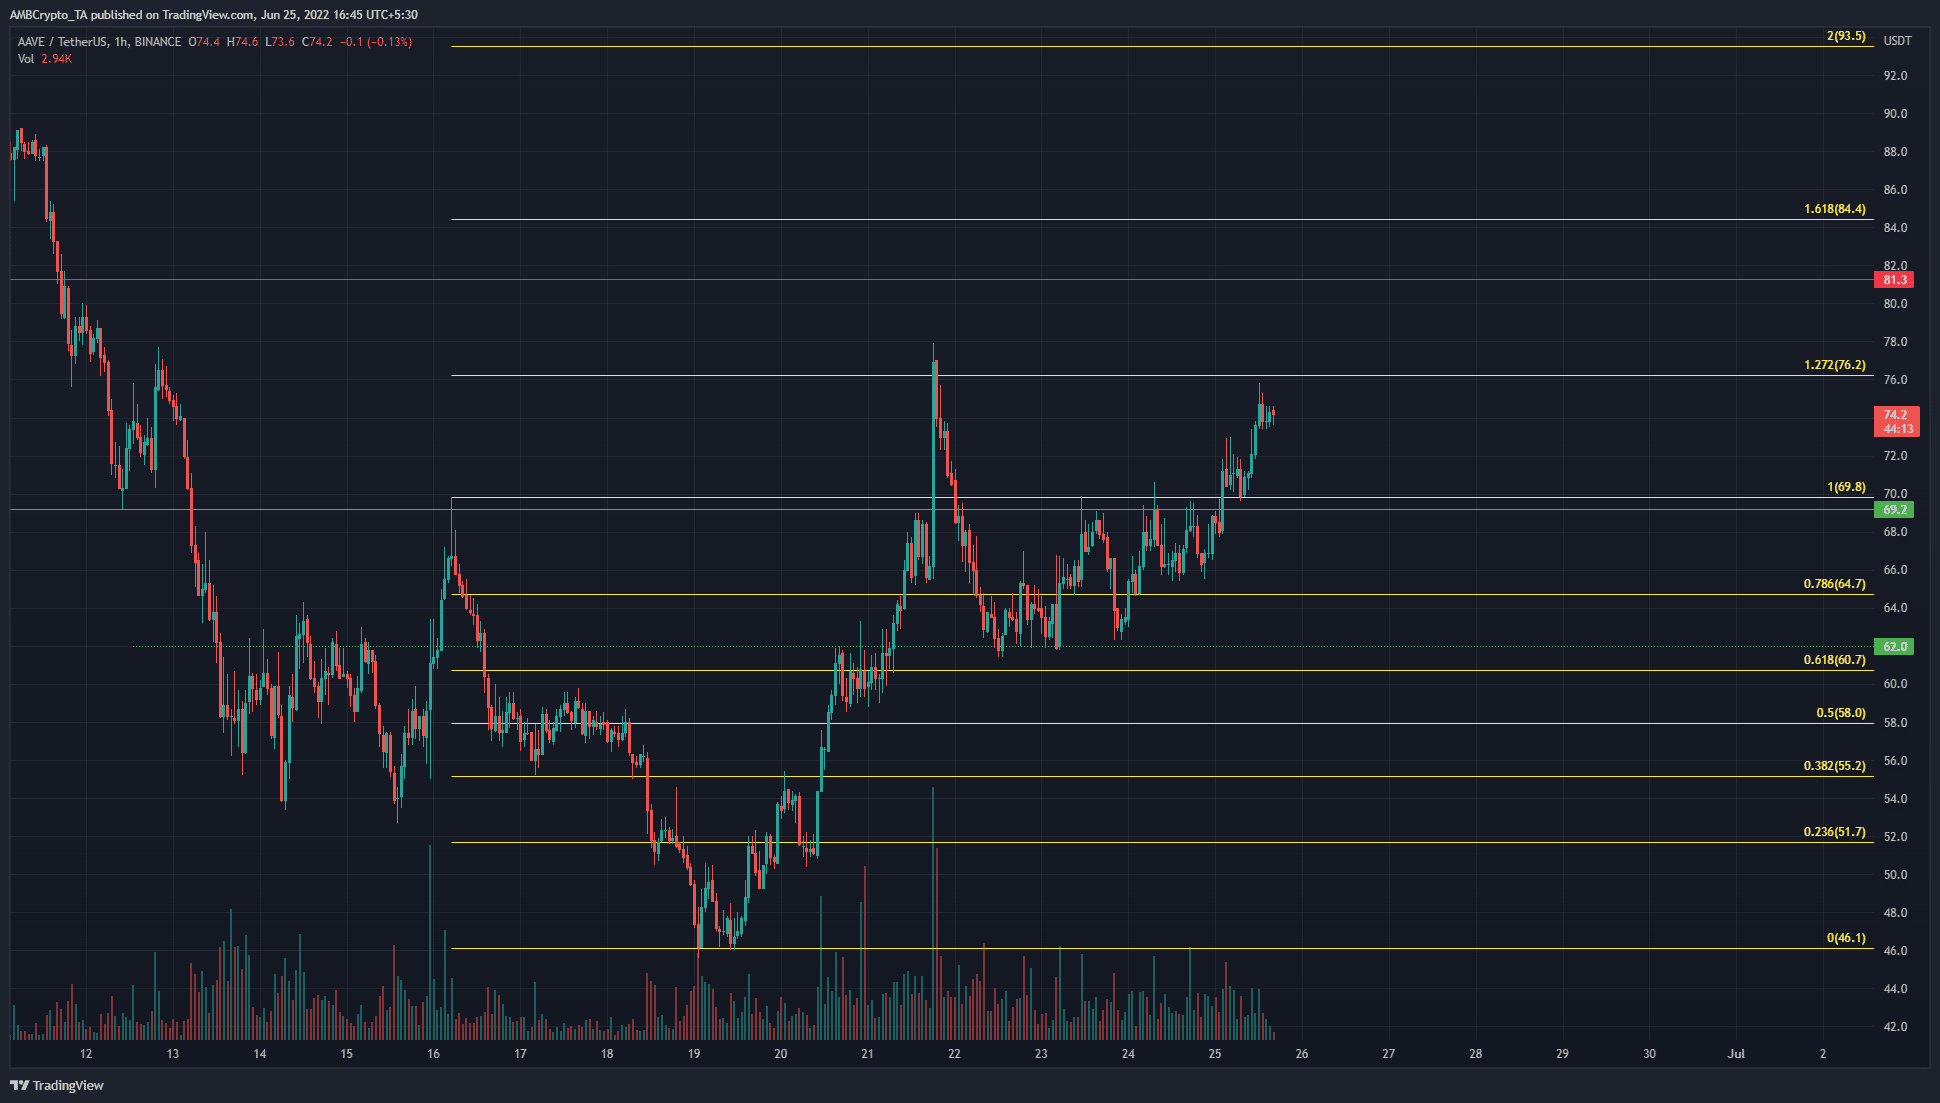
A set of Fibonacci retracement levels were drawn from $69.8 to $46.1. The price was able to break above the 38.2% retracement level swiftly and rose as high as the 27.2% extension level before a deep pullback. The pullback was halted at the $62 support level before another push higher by AAVE.
The resistance at the 27.2% extension level added credence to the Fibonacci levels drawn. Hence, the next levels of resistance to take-profit at are the 61.8% and 100% extension levels, as well as the 27.2% level itself, in the scenario that AAVE climbed that high.

The indicators showed a bullish picture behind Aave on lower timeframes. The RSI has been above the neutral 50 line over the past few days to indicate an uptrend in progress. The AO has also managed to stay above the zero line.
The OBV has also climbed sharply, indicating strong demand behind the asset and confirming the uptrend to be genuine.
Conclusion
Based on the price action itself, it was possible that the $75-$79 area would be a liquidity sweep before another move downward for AAVE. Therefore, risk management would be of extra importance in this trade. An optimal entry could be in the $65-$68 area. The $76 and the other extension levels above it can be used to take a profit.
A session close below the $62 level would invalidate this idea and can serve as a stop-loss.