AAVE’s bullish morning star candlestick pattern could see this move next

Forming renewed highs above 23.6% Fibonacci resistance, AAVE was under another northbound leg on the daily chart. A close above the 38.2% Fibonacci level would allow the altcoin to propel to a newer high around the $207-mark. Thus, eventually opening a route towards the 200 EMA (green) and the $224-level.
On the other end of the spectrum, bears would look to immediately respond at the $193-$207 range to avoid an extended rally. At press, AAVE traded at $193.55.
AAVE Daily Chart
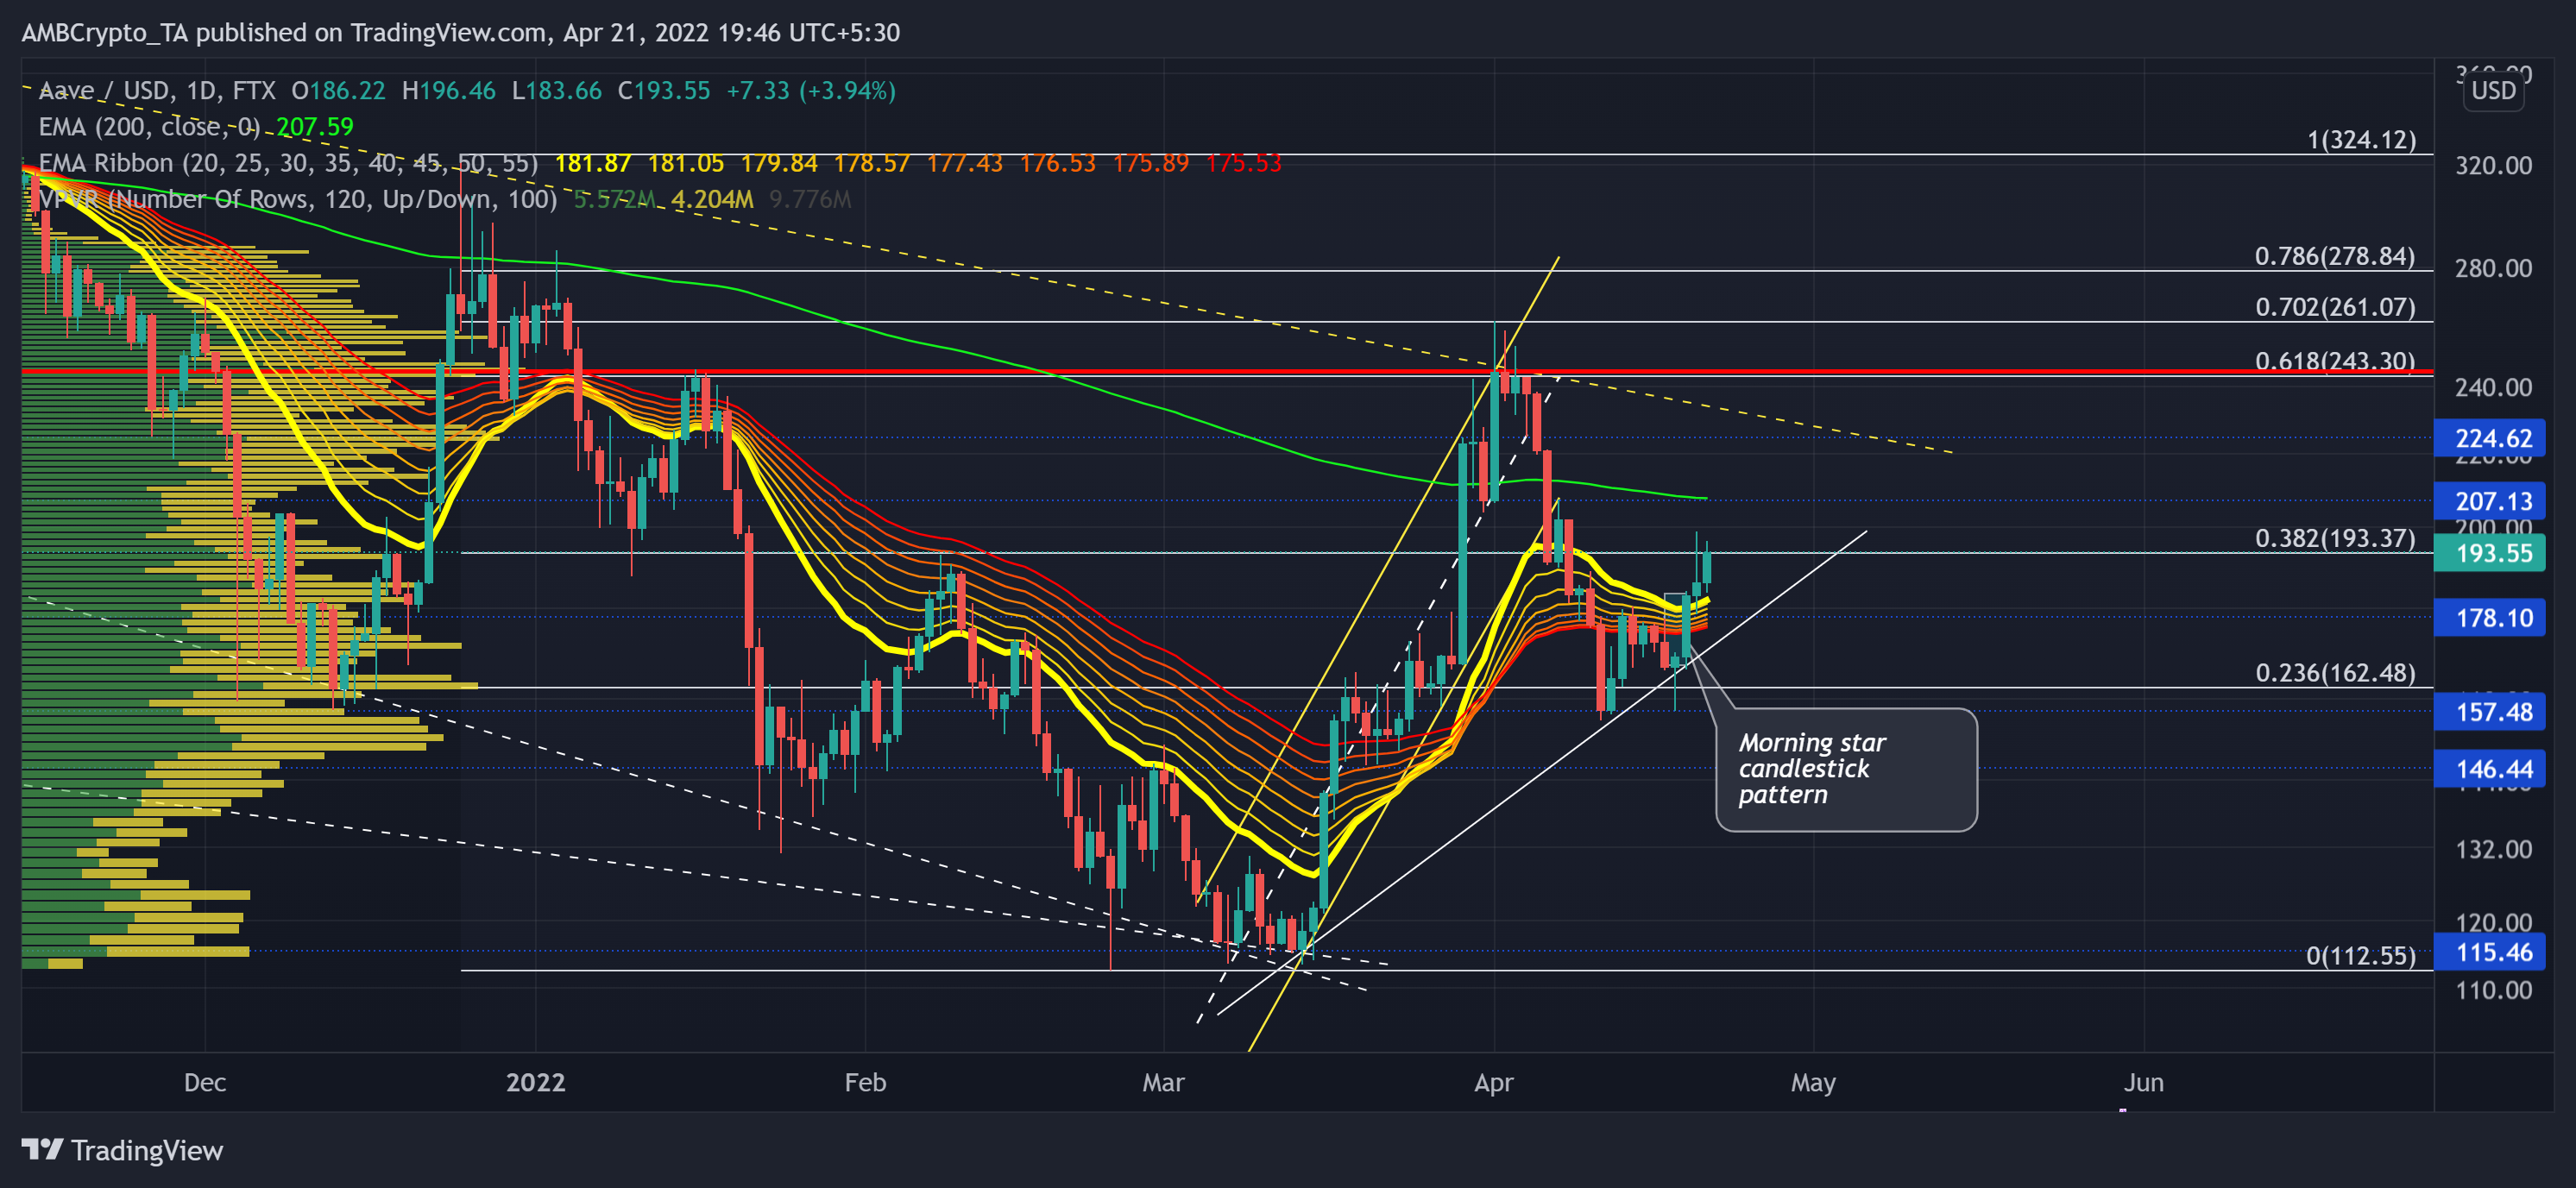
The altcoin is in a long-term tilt as it still struggled to break free from the bonds of its eight-month trendline resistance (yellow, dashed). While the bulls have kept the $112 floor intact for nearly 13 months, AAVE registered a nearly 130% ROI from this level in its up-channel (yellow) rally.
After rebounding from the 61.8% Fibonacci level and the Point of Control (POC, red), AAVE broke down from its ascending channel. Consequently, after an over 40% drop from 1-12 April, the bulls resurged from the month-long trendline support (white).
After observing a bullish morning star candlestick pattern on its daily chart, the bulls have reiterated their viewpoint on maintaining their edge. Therefore, the buyers reclaimed their position above the EMA ribbons. To spark a rally towards the 200 EMA, bulls had to topple the $193-mark and ensure a still close above it. Should the buying strength suddenly dwindle, the 20 EMA could provide an immediate testing point.
Rationale
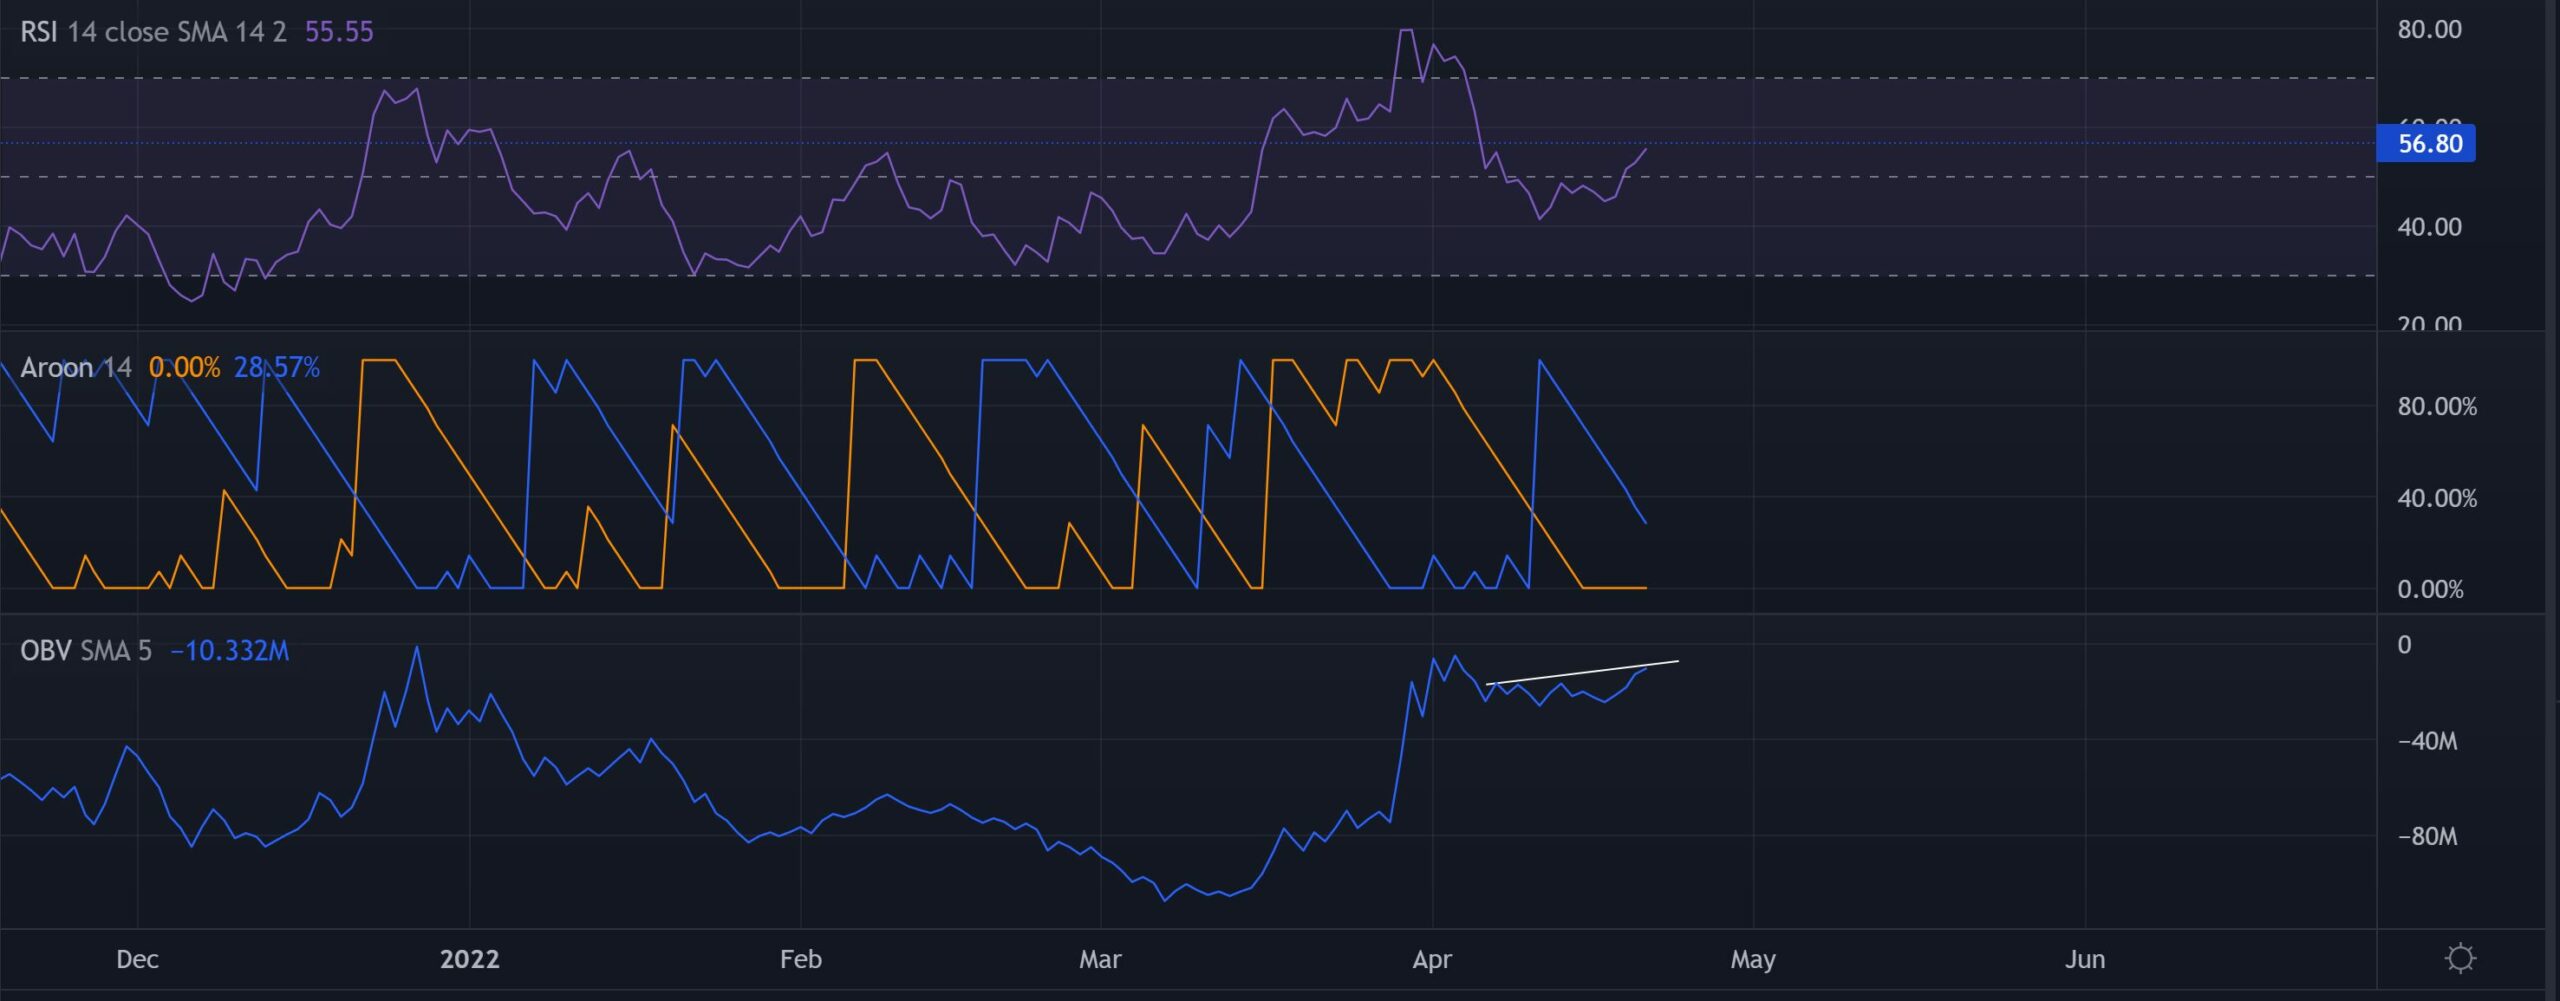
The higher peaks on the Relative Strength Index have led to a rally above its equilibrium. A close above the 56-mark resistance would further affirm the chances of a continued bullish rally on AAVE’s charts. To top it up, the Aroon up (yellow) rested at its base while the Aroon down (blue) persisted in its southward movement. This reading hinted at the likelihood of continued bullish moves in the days to come.
However, the OBV marked higher peaks consistently for the last two weeks and diverged with the peaks of price. So, any price reversal can trigger a bearish divergence.
Conclusion
Looking at the healthy readings on its daily RSI and the Aroon indicator along with the position on EMA ribbons, the uptrend could continue in the coming days. The threats along the OBV may cause a short-term setback before the bulls try to regain momentum.
Nonetheless, AAVE shares a 65% 30-day correlation with Bitcoin. Hence, keeping a close watch on the king coin’s movement would be vital in making a profitable bet.