NEAR faced rejection at this zone but investors needn’t worry, thanks to…

Disclaimer: The findings of the following analysis are the sole opinions of the writer and should not be considered investment advice
On the higher timeframes, NEAR Protocol has a bullish market structure. It appeared to form a range in the past three weeks between $15.2 and $17.75. Could this be a phase of distribution for NEAR, or was the price set to rocket past the $17.7 zone of resistance?
NEAR- 1 Day Chart
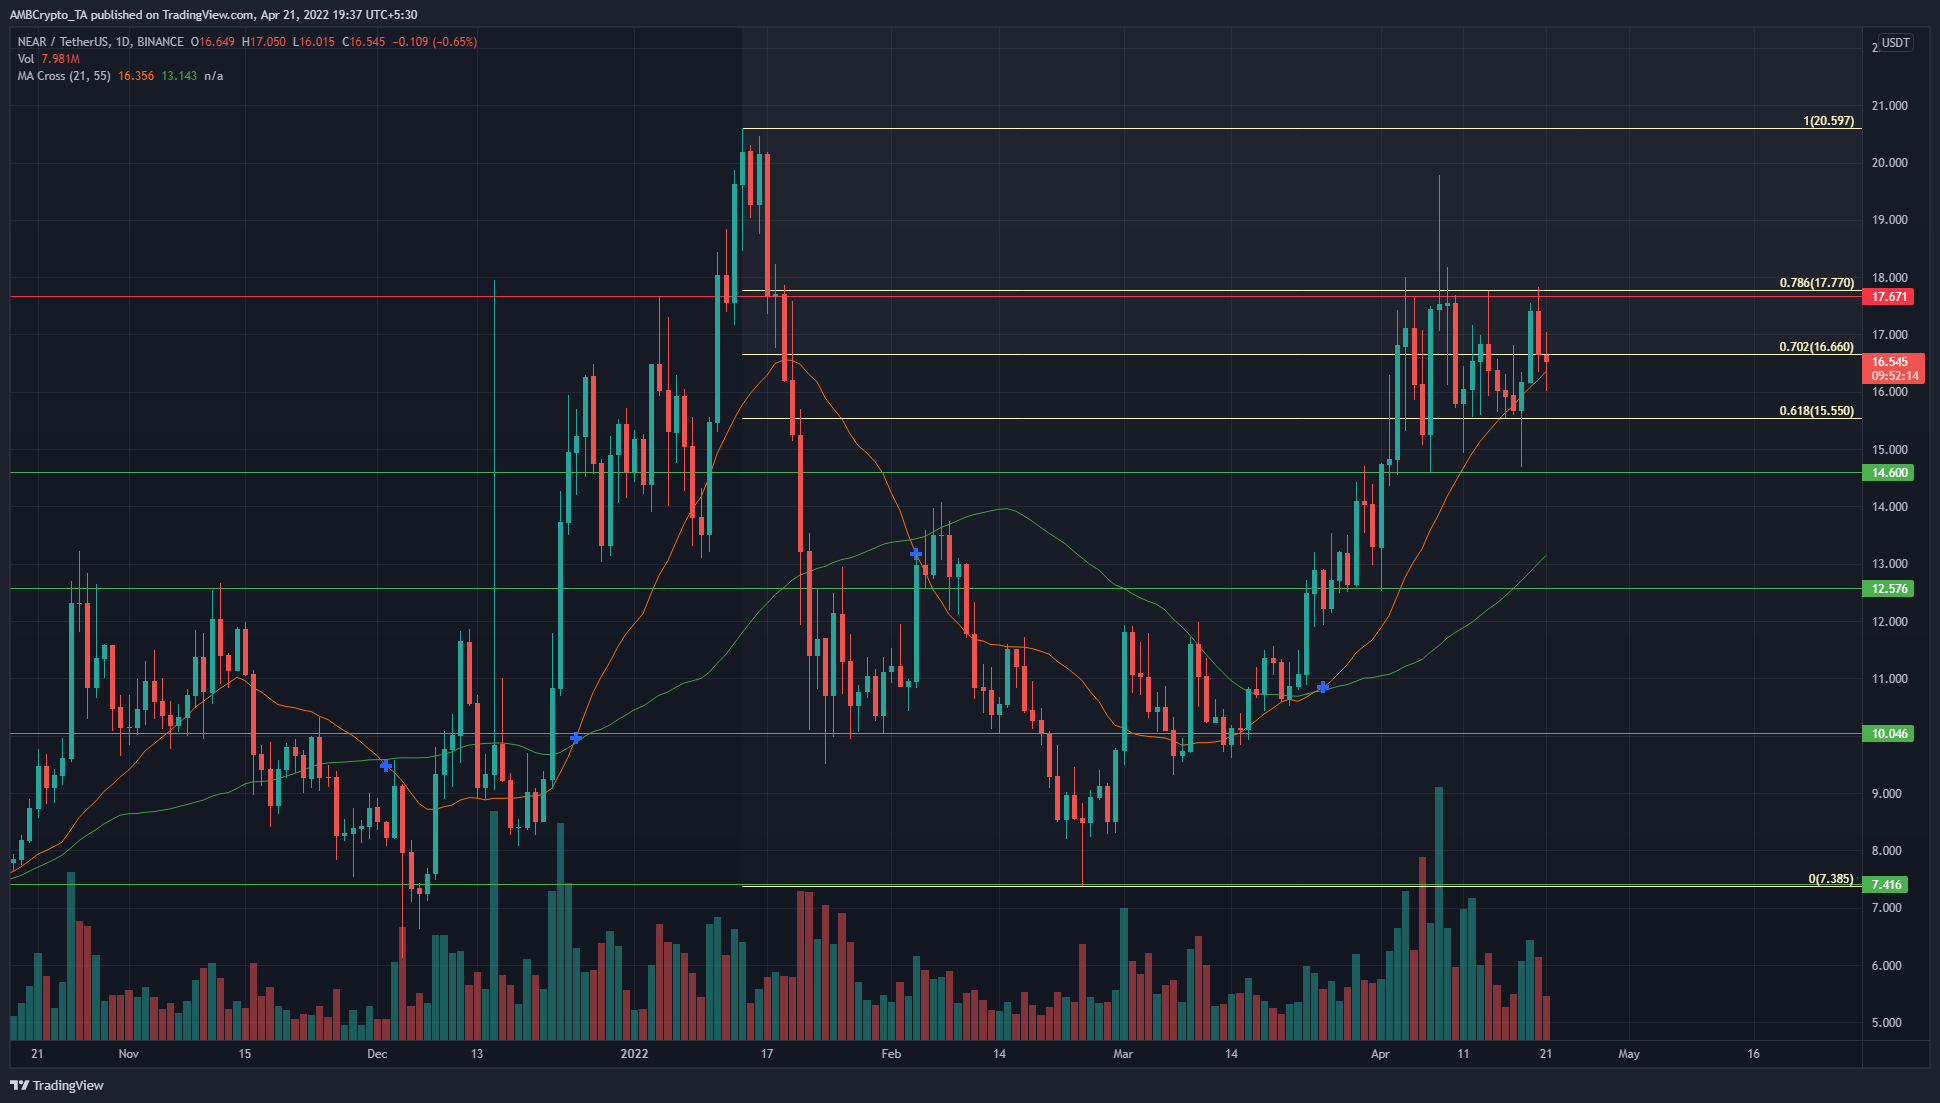
Based on the downward move from $20.59 to $7.38 earlier this year, a set of Fibonacci levels (pale yellow) was plotted. It showed that the 78.6% retracement level for this move lay at $17.7, and the 61.8% level at the $15.55 level.
Hence, these are levels of technical importance in the days to come. Sellers would want to look for shorting opportunities, while buyers would be waiting for a breakout beyond $17.7 to buy. Moreover, there is a horizontal resistance level at $17.67, adding confluence to the idea of bearish strength.
On NEAR’s recovery from the $7.4 lows, there has been strong buying demand. Zooming out further, it can be seen that NEAR has been forming higher lows on the chart going back to July 2021.
In the event that NEAR can close a daily session above $17.7, it would be likely that the bulls can drive prices toward $20 and $24.
Rationale
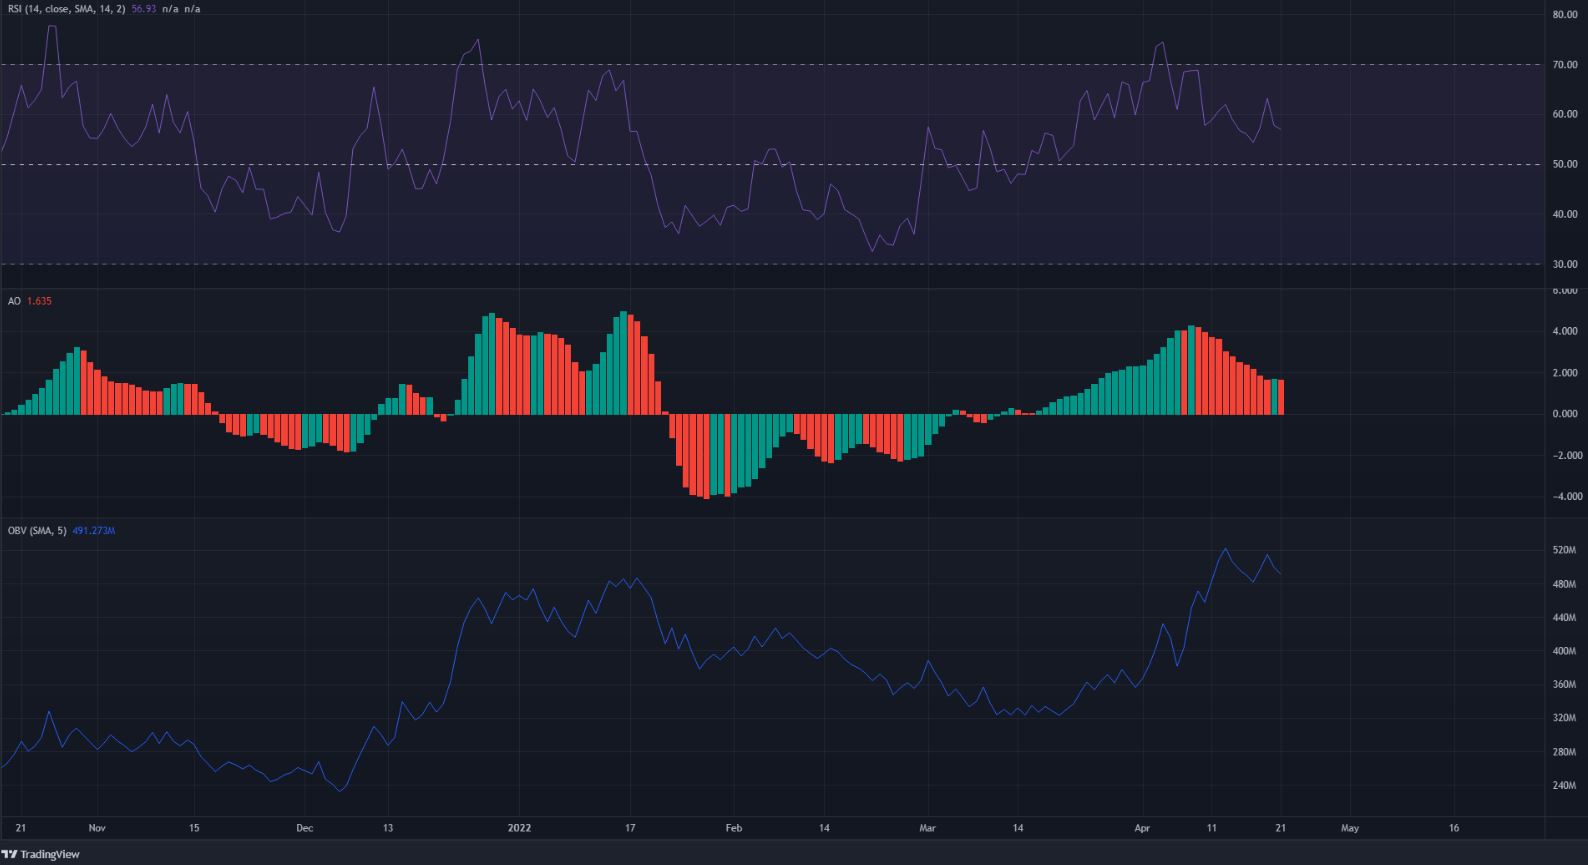
The RSI has remained above neutral 50 over the past month, indicating an uptrend in progress. In the past two weeks, the bullish momentum has waned as NEAR tested the $17.7 resistance zone. The Awesome Oscillator also formed red bars on its histogram for much of April so far to indicate a pullback, rather than bearish momentum.
The OBV has been climbing throughout April and did not see a severe dip in recent days. This suggested that buying volume continued to outweigh selling volume.
Conclusion
In early March, the price reclaimed $10 as a support and showed that the previously bearish market structure was about to be broken. In recent days, the structure has been bullish and a drop below $14.6 would need to be seen before the structure favors the bears once more.
On the other hand, a session close above $17.7 could see NEAR extend toward $20 and $24. The high buying volume in recent weeks suggested that this was a more likely scenario to unfold.