Cardano [ADA] could bounce to $0.9 in the next few days only if…

Disclaimer: The findings of the following analysis are the sole opinions of the writer and should not be considered investment advice
On shorter timeframes, announcements of technical improvements could be argued to have a positive impact on the price. A recent proposal to increase the block size of the Cardano mainnet appeared to be greeted by gains on the price chart of ADA. Data from Santiment showed that ADA was trading in an area where, historically, the price has rallied from. Could history repeat itself?
ADA- 1 Day Chart
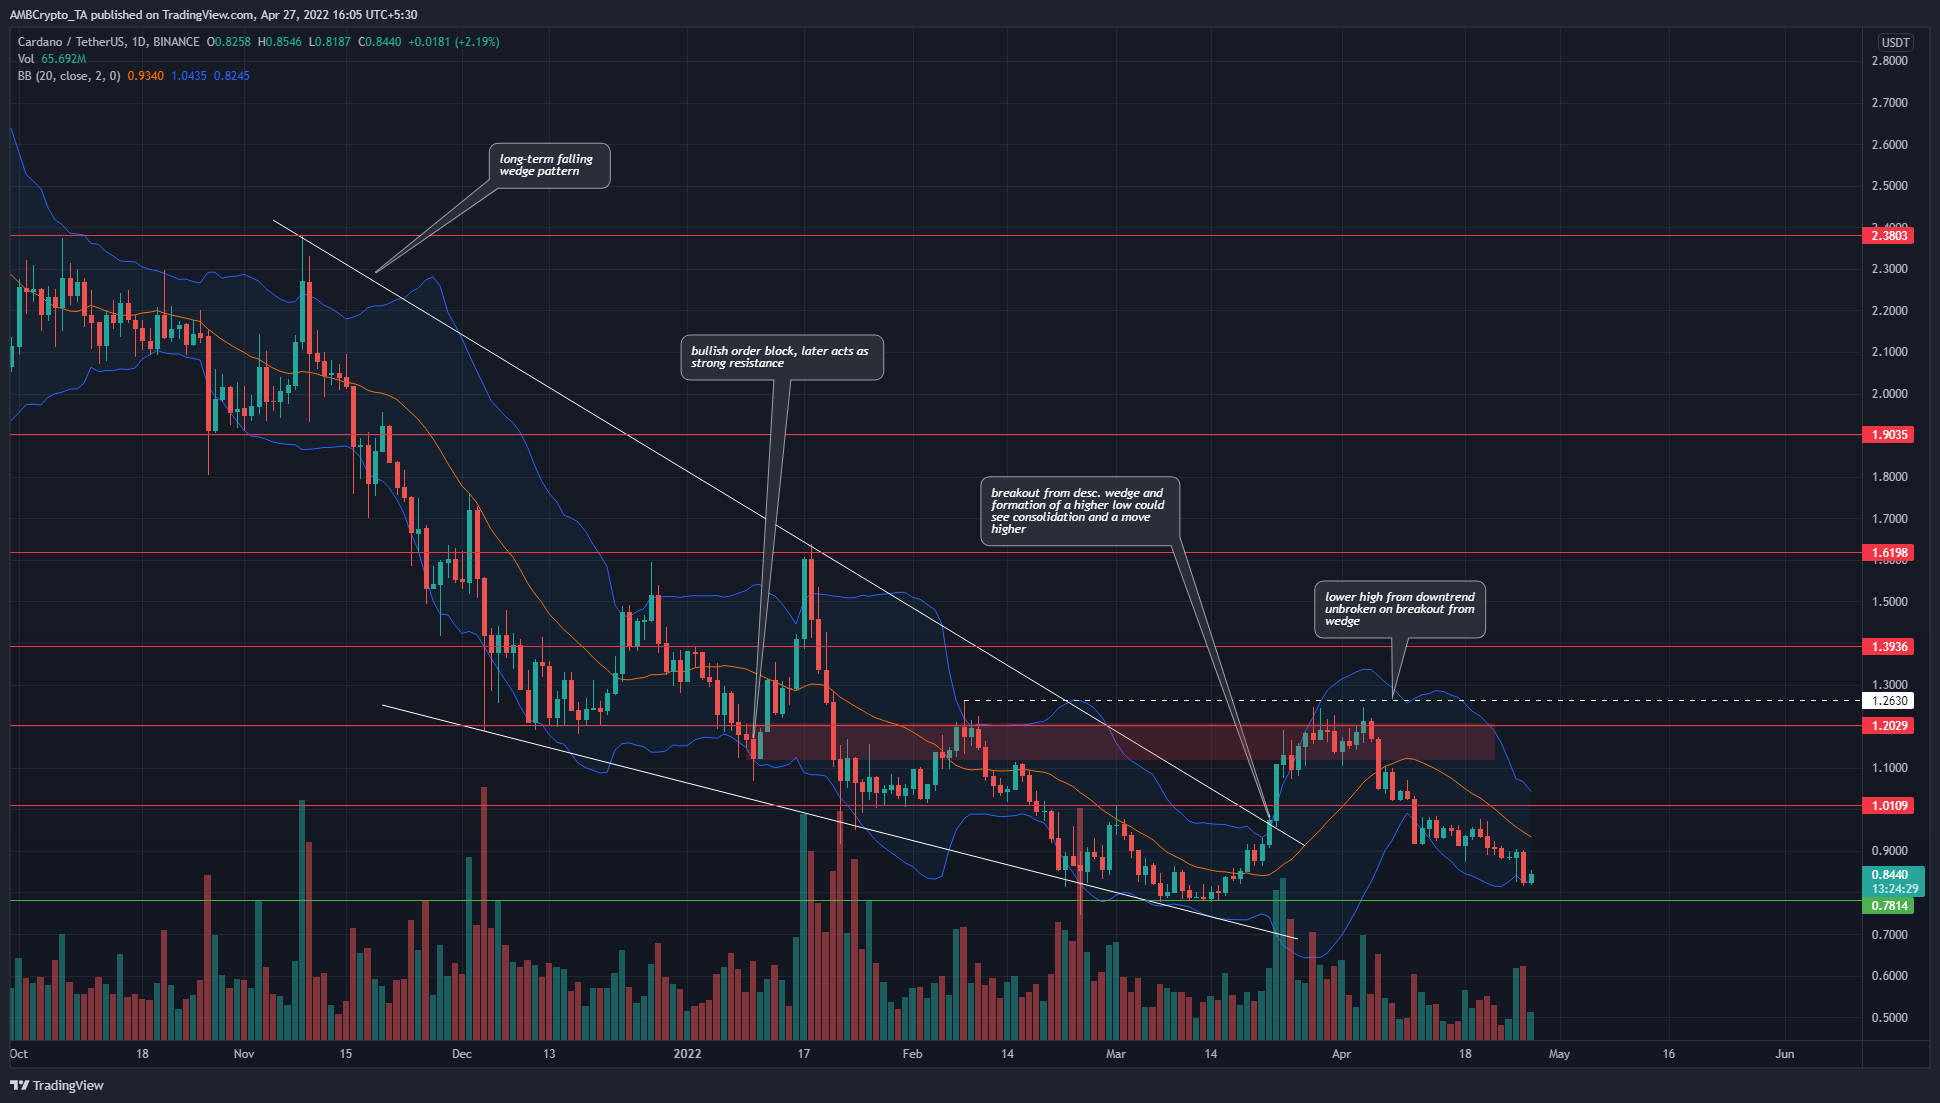
Going back to early November and December, we can see a falling wedge pattern develop. In the months from November to March, the price has dropped beneath multiple levels of long-term horizontal support levels. The one that has been successfully defended was $0.78- but it could come under siege once again.
ADA was unable to rise past the $1.2 zone of supply, as the breakout from the wedge pattern failed to flip the long-term trend in favor of the bulls.
Now the question- Is Cardano being accumulated by the whales? Or, was the mid-March rally doomed to lose steam at the $1.2 area, before a resumption of the former downtrend? The indicators showed a bearish picture.
On the chart, the Bollinger bands indicator was quite wide to suggest volatility around ADA in recent weeks. Moreover, the price was beneath the 20-day moving average and showed that, in the next few days, a revisit to $0.9 could be a selling opportunity.
Rationale
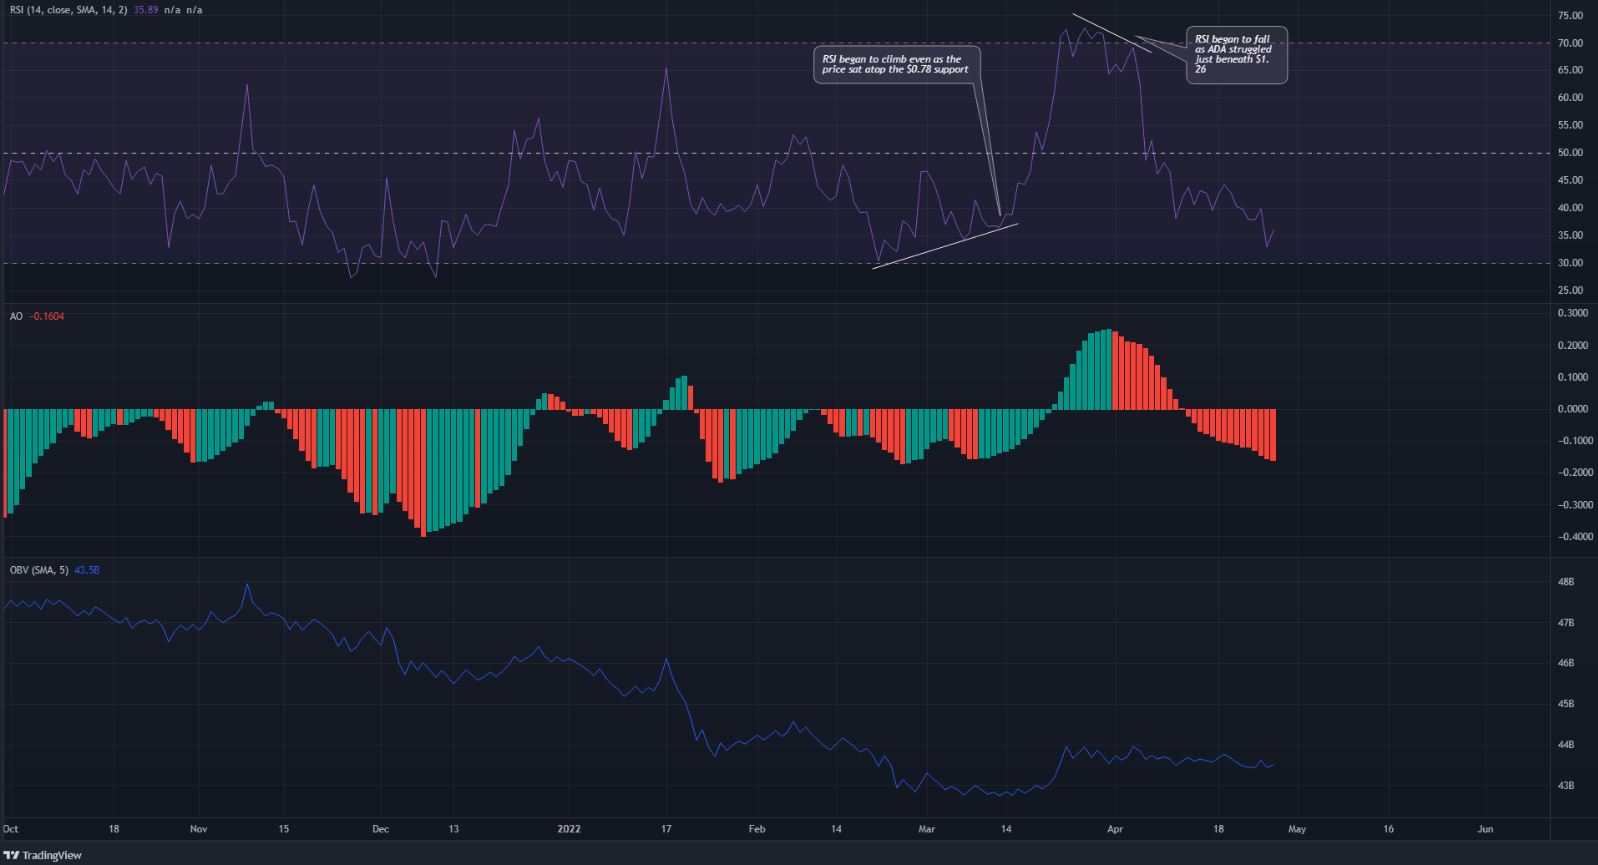
The past two months saw a bullish divergence over multiple days at the $0.78 support and a bearish divergence at the $1.2 level. These signaled the end of the prior bearish and bullish trends, respectively. At the time of writing, momentum was strongly bearish.
The Awesome Oscillator has been forming red bars on its histogram in the past three weeks to denote rising downward momentum. While the OBV did see an uptick in mid-March, it was not a particularly strong bounce. This showed that demand was rather weak.
Conclusion
Weak demand and rising bearish pressure could see ADA move toward $0.78 once again, although it could bounce to $0.9 in the next few days. However, a trend reversal signal was not in sight yet. There were no divergences, nor the arrival of high demand behind ADA yet.


