ADA investors can expect some roadblocks on the way to 2023. Details inside…

- An assessment of a series of on-chain metrics hinted at the commencement of a bull run
- In the mean time, sellers still had control of the ADA market
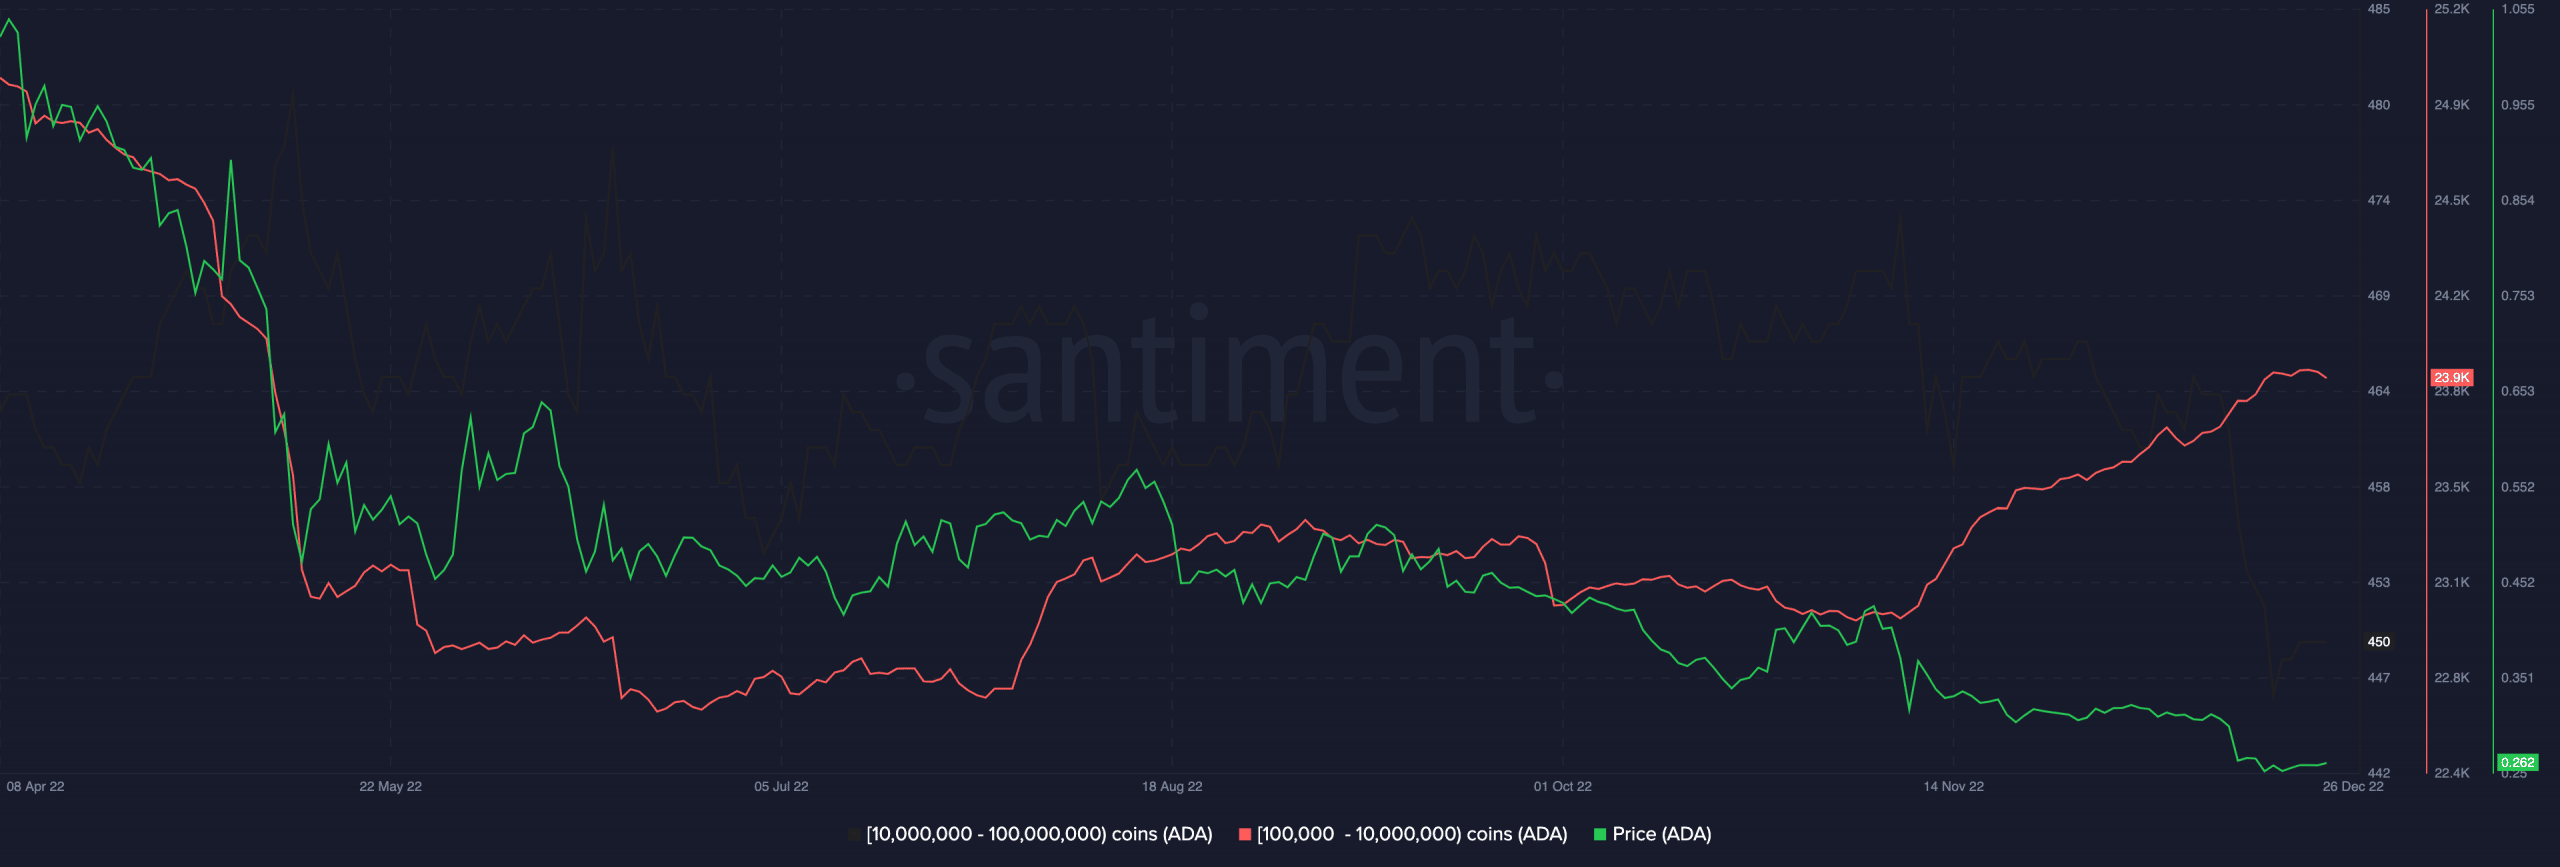
On-chain assessment of Cardano [ADA] revealed a series of bullish activity hinted at the commencement of a new bull cycle in 2023. A look at ADA’s supply distribution revealed a pattern of coin accumulation by shark and whale addresses that hold between 100,000 to 10 million ADA coins.
According to data from on-chain analytics platform, Santiment, this cohort of ADA investors accumulated aggressively since 8 November. The count of these addresses has since gone up by 4%.
📊 Is #Cardano severely undervalued at this point? One of @santimentfeed's key community members certainly sees data making this case, such as sharks & whales (holding 100K to 10M $ADA) accumulating aggressively these past 6 weeks. Read the latest insight! https://t.co/TPskmWBsOH pic.twitter.com/HC0aEWIVns
— Santiment (@santimentfeed) December 27, 2022
Read Cardano’s [ADA] Price Prediction 2023-24
However, within the same period, ADA’s price dropped by 42%. The opposite movement of ADA’s supply distribution and its price created a bullish divergence that often results in the exit of sellers from the market.
A price rebound would follow if these key holders remain resilient despite the plummeting price.
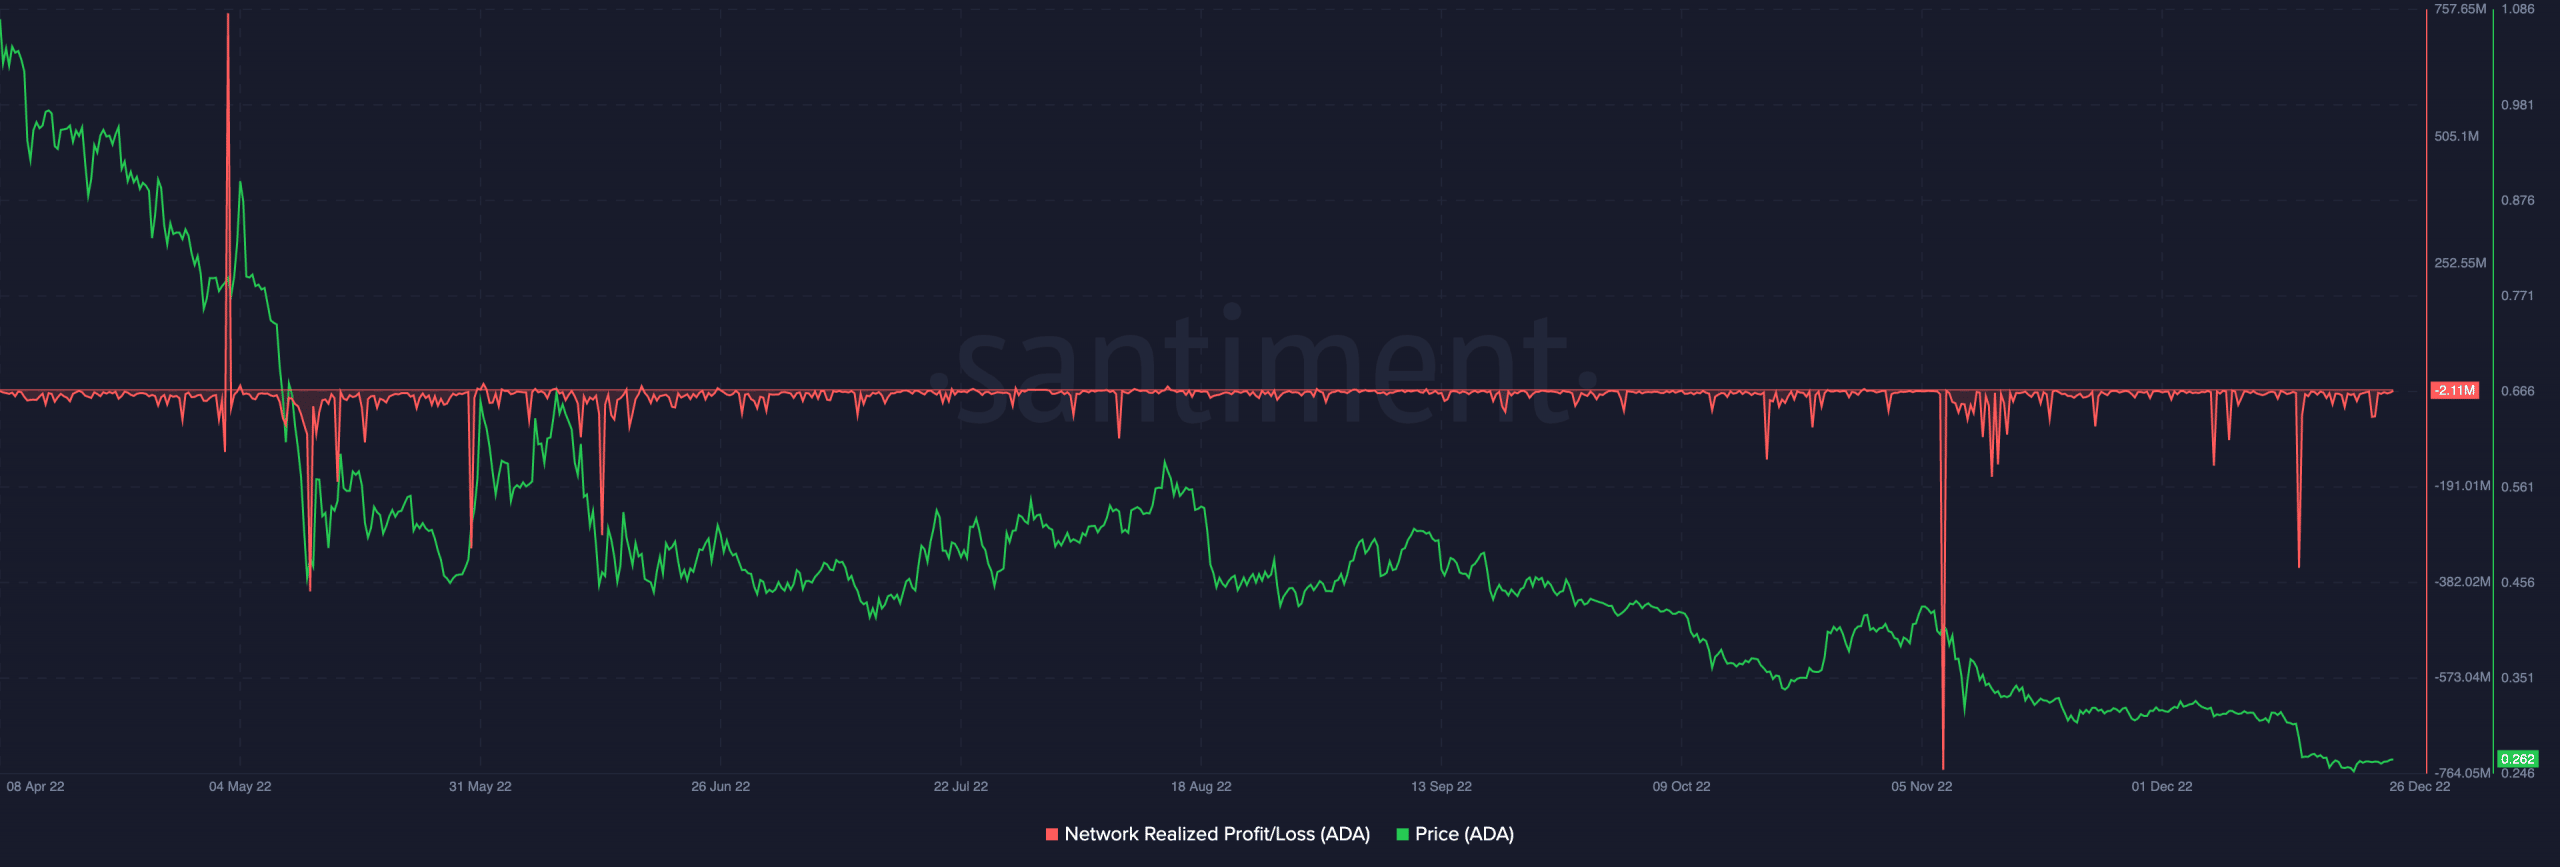
Furthermore, an assessment of ADA’s Network Profit/Loss metric (NPL) revealed that fewer coins moved at a loss with every big price drop in the last few weeks. This hinted at sellers’ exhaustion and the exit of “paper hands” from the ADA market.
Generally, NPL dips often signal short-term capitulation of ‘weak hands’ and the re-entry of ‘smart money’. This is why they tend to coincide with local bounce-backs and periods of price recovery.
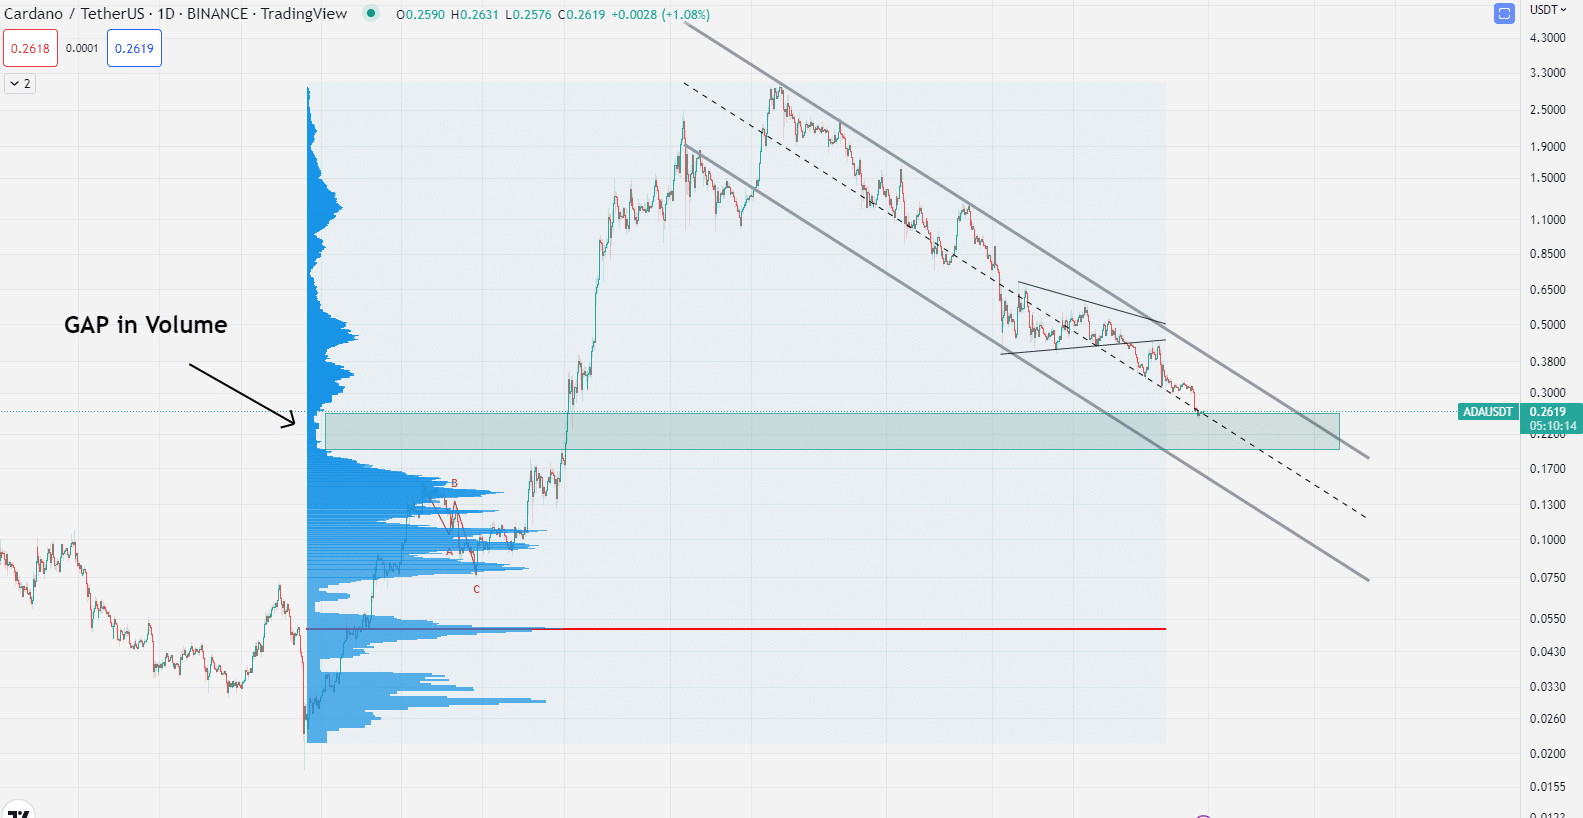
In addition, an assessment of ADA’s performance on a daily chart revealed that the market was close to filling the volume gap. Typically, significant coin accumulation occurs at this level.
But, do not get carried away
While there might be bullish signals on the horizon, a closer look at ADA’s price movement on the daily chart revealed that bearish sentiment continued to plague the altcoin.
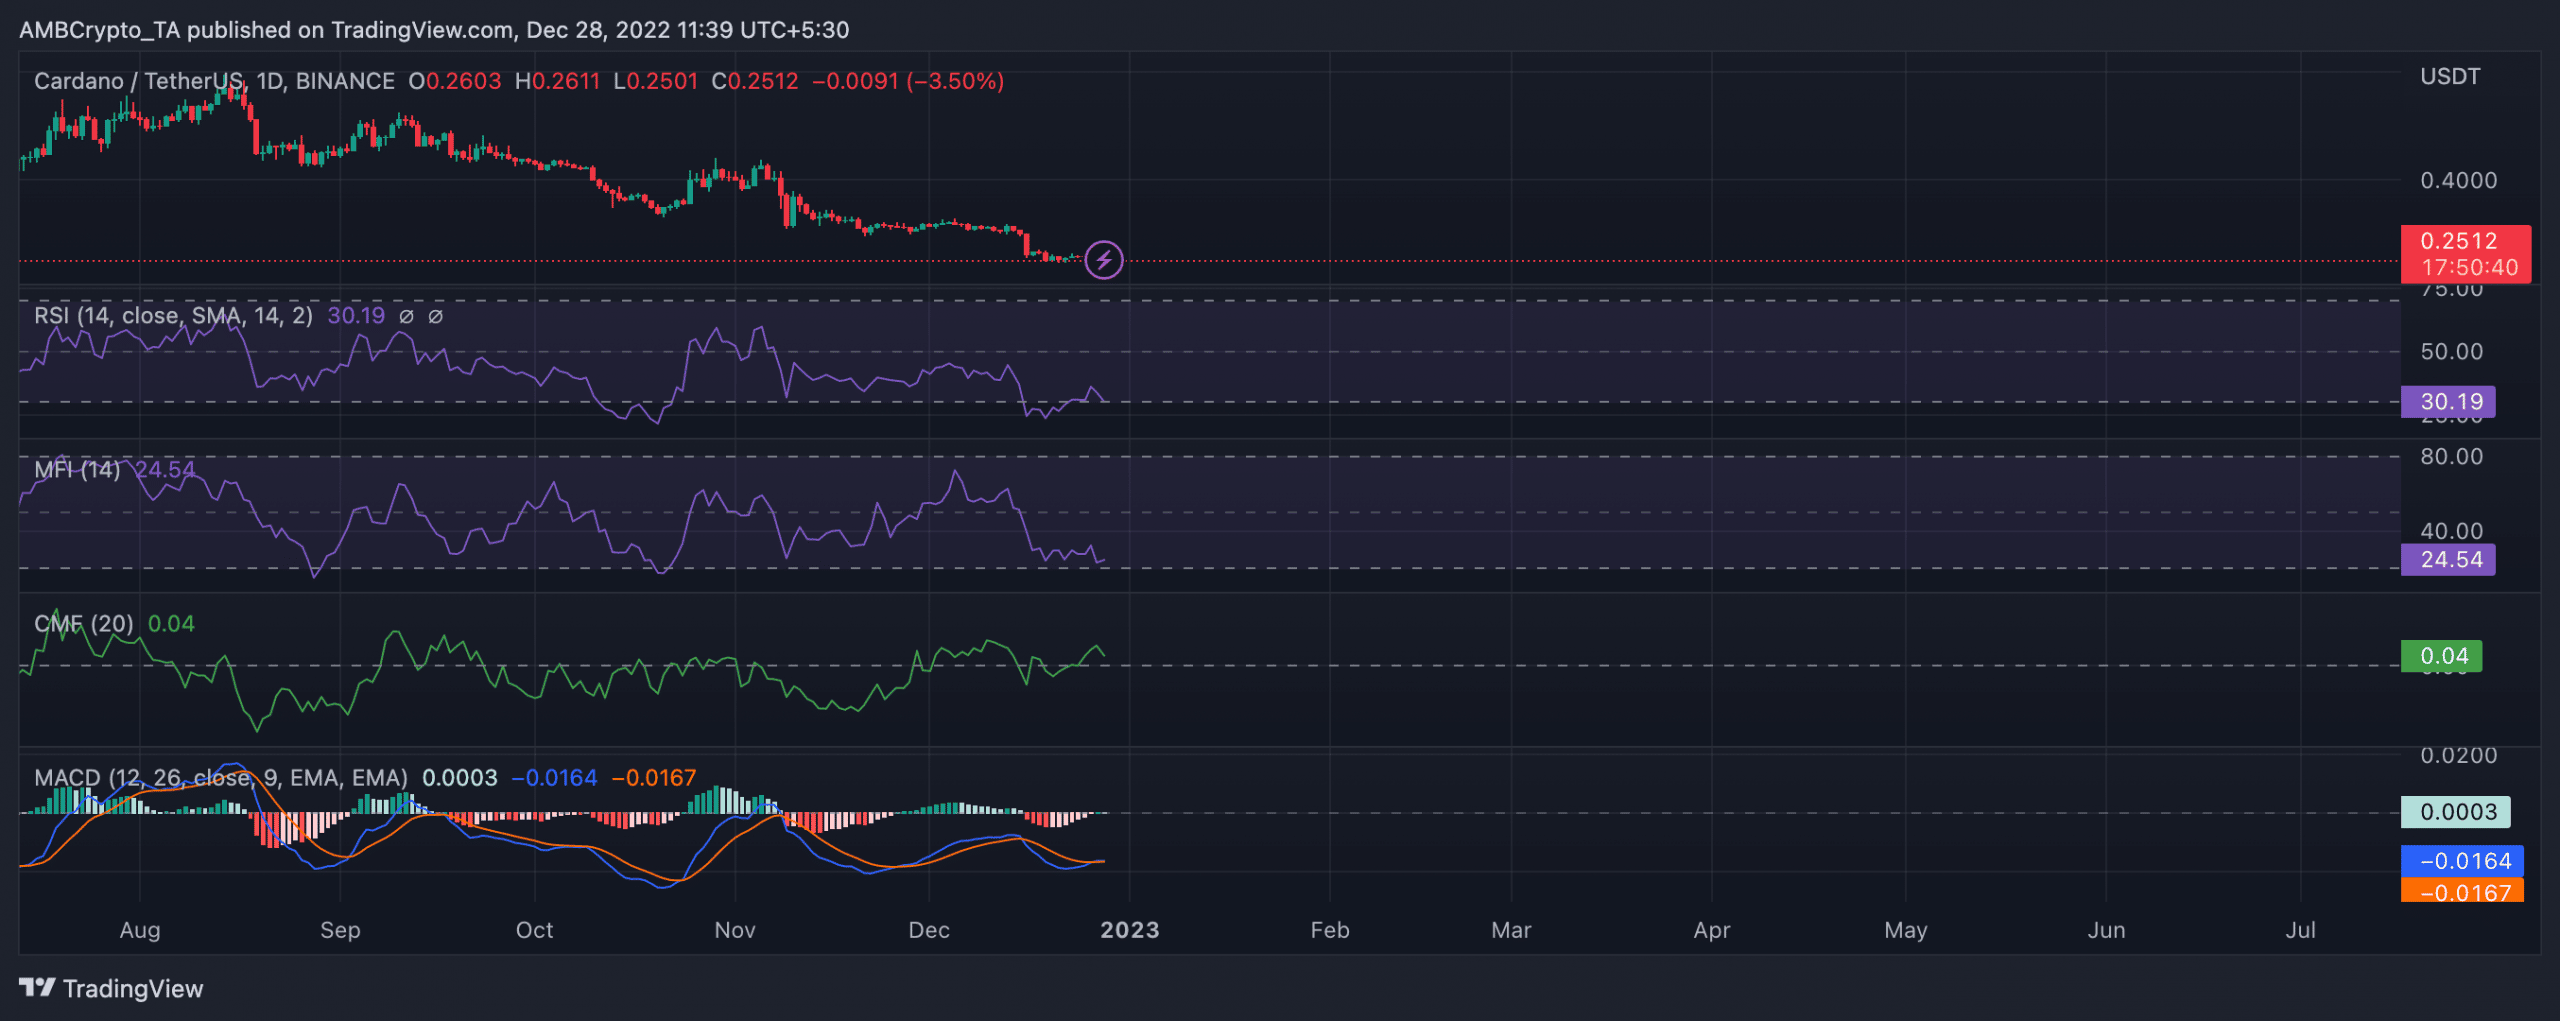
ADA was severely oversold at press time as key momentum indicators laid beneath their respective neutral zones. For example, ADA’s Relative Strength Index (RSI) was found at 30.19. Likewise, its Money Flow Index (MFI), was in a downtrend and pegged at 24.54 at press time.
Are your ADA holdings flashing green? Check the Profit Calculator
Showing that ADA still lingered in a bear cycle, the Moving Average Convergence Divergence (MACD) line remained intersected with the trend line in a downtrend, posting only red histogram bars. This has been the situation since 16 December, when selling activity started to rally.
Interestingly, the dynamic line (green) of ADA’s Chaikin Money Flow (CMF) rested above the center line at 0.04. With its price making lower lows, this created a bullish divergence that is often taken as a buy signal.
A CMF buy signal occurs when the price of an asset makes a lower low, but the CMF indicator makes a higher low and starts to increase. This often occurs when the asset is in oversold territory, as is the case here.