What next for Cardano now that $1-resistance is broken

Disclaimer: The findings of the following analysis are the sole opinions of the writer and should not be considered investment advice
Cardano has broken out of a falling wedge that has been in play for many months now. The $1 resistance level, and the area of supply just above it, have been broken. Moreover, the $1.22 resistance also appeared to be broken. From the $0.78 lows, a move to $1.4 would represent a 74% rally. In most other markets, such a rally would be groundbreaking. But this is crypto, and although Cardano has a bullish market structure, will this see a rally toward or beyond $1.6?
ADA- 1D
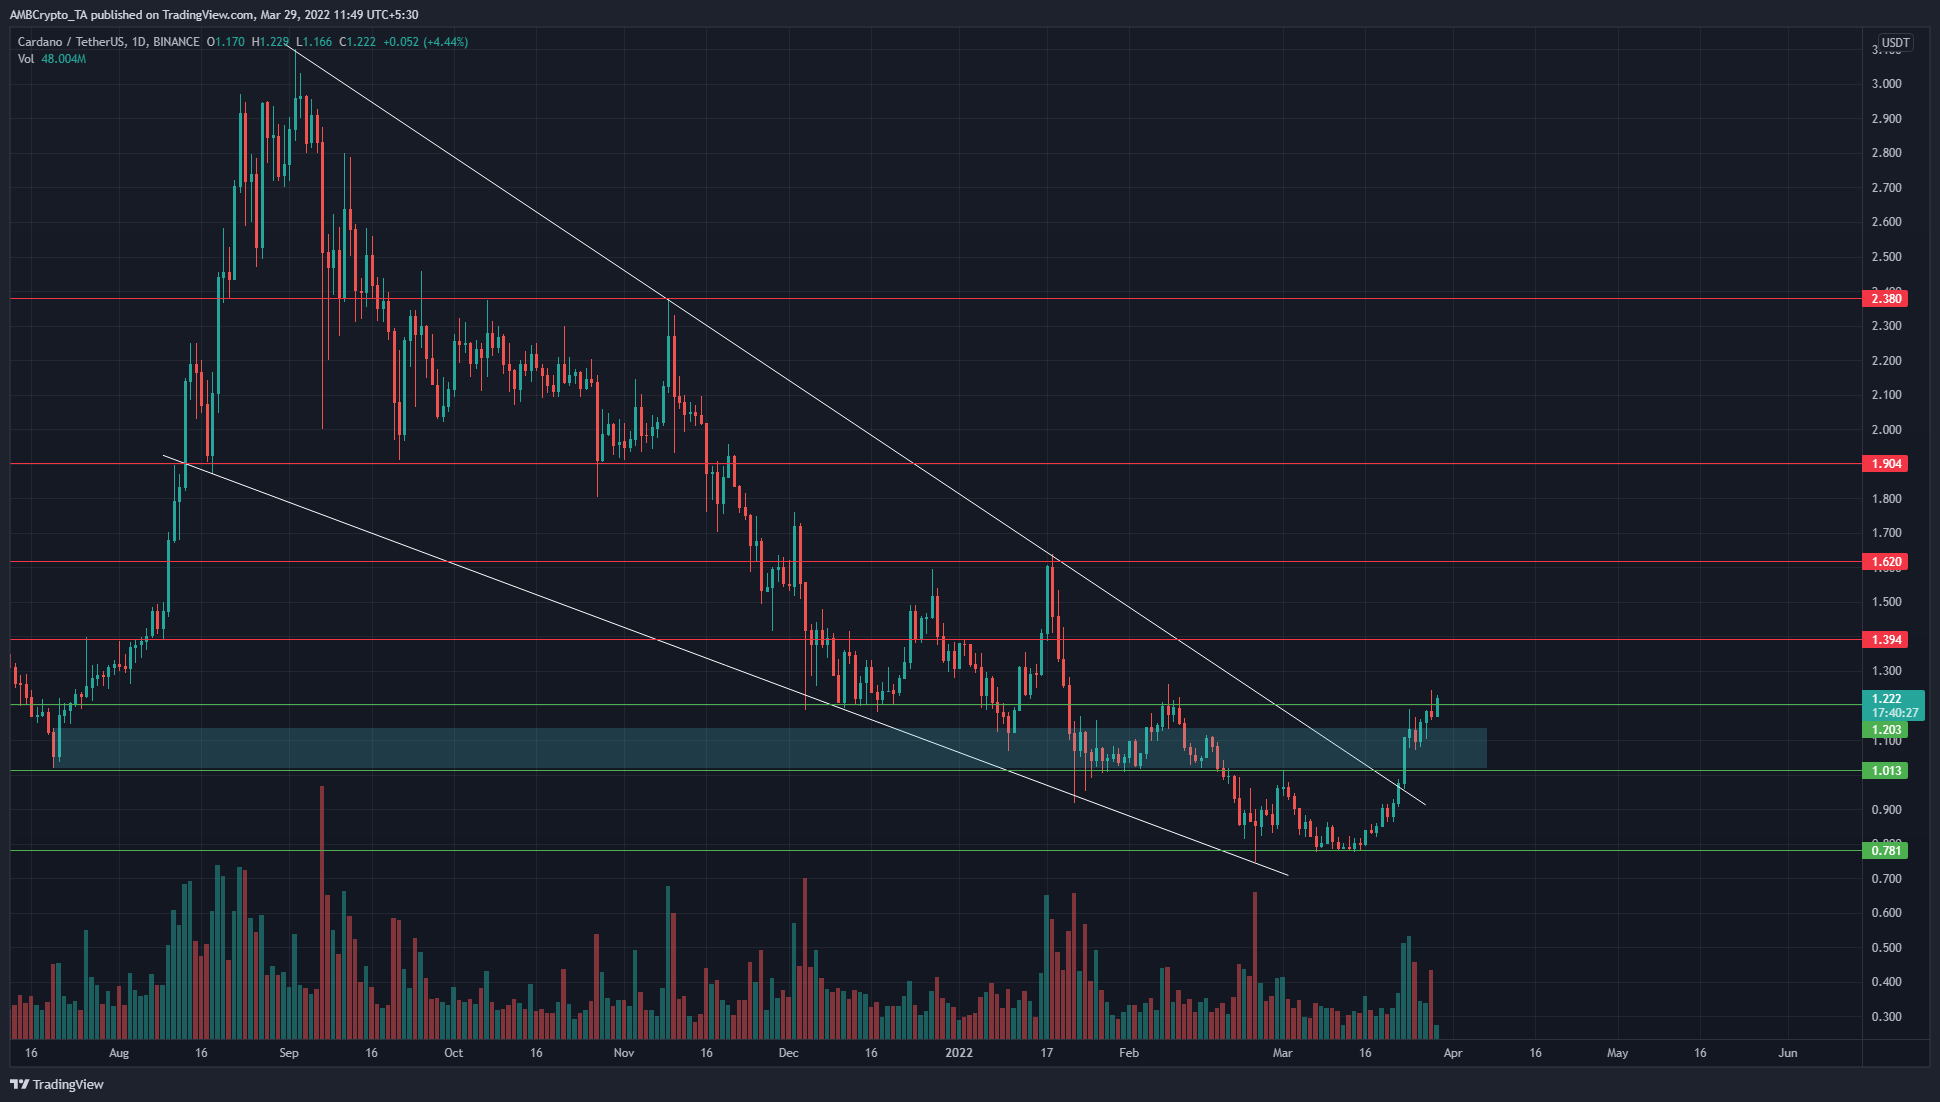
Cardano has been on a downtrend since September, and the most recent lower high on the daily chart was a test of the $1 level as resistance. This level has been broken and is a bullish market structure break. At the time of writing, ADA was on the verge of breaking yet another lower high of the previous downtrend at $1.27.
The $1 area had been a bullish order block in mid-July and had been flipped to an area of supply in mid-February. In the past two weeks, this area has once again been broken and retested and has found demand.
Trading volume was considerable and market conditions were bullish.
Rationale
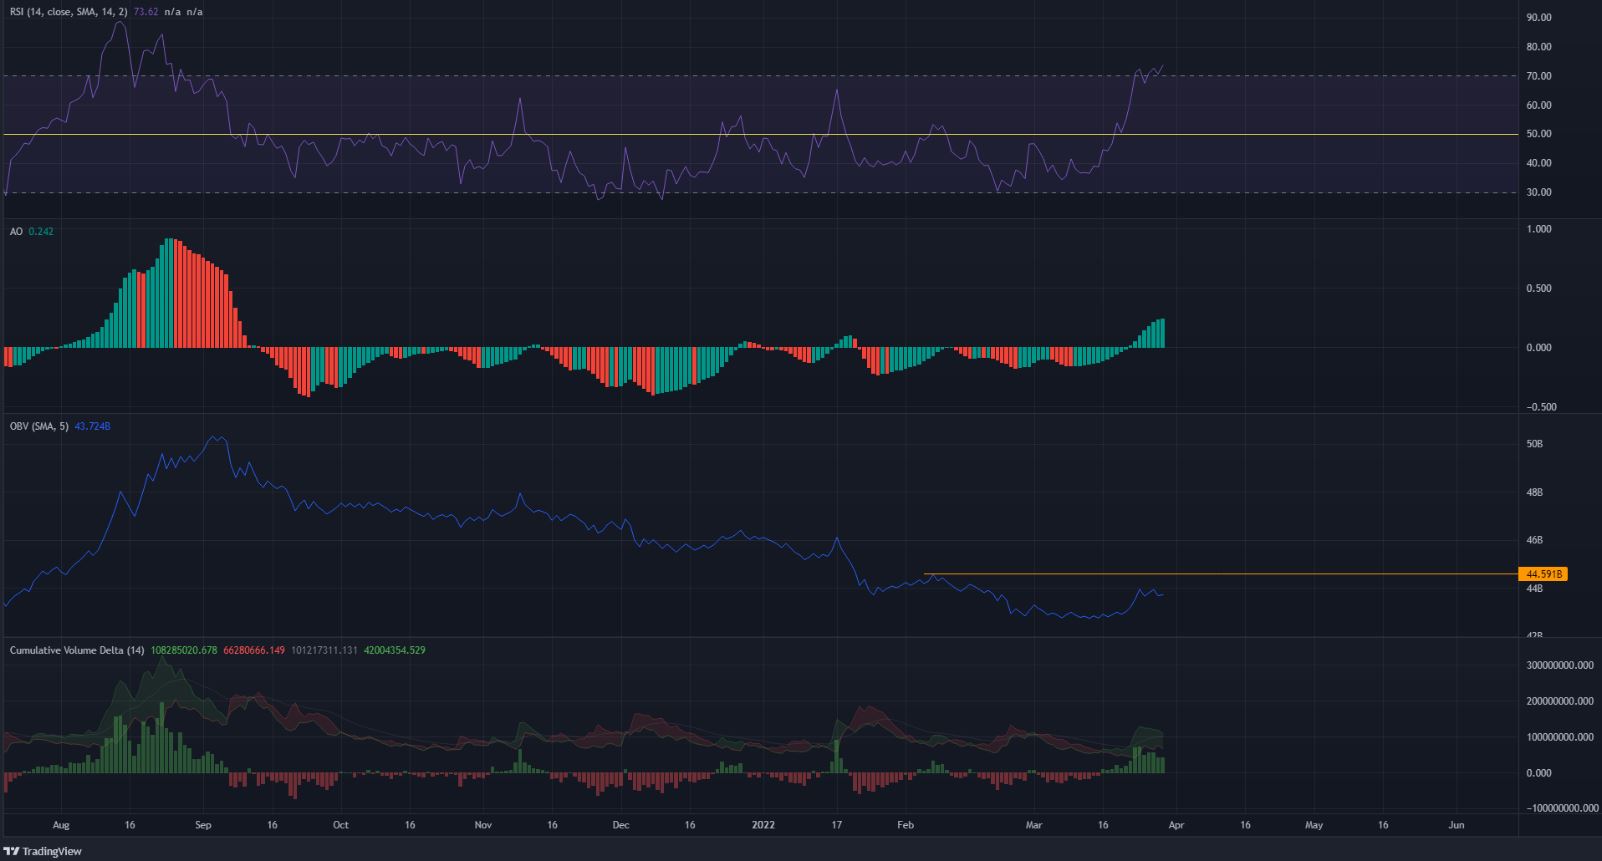
The RSI climbed past neutral 50 and was in overbought territory, which showed a bullish trend was likely established. The Awesome Oscillator crossed over above the zero line and also showed strong bullish momentum.
The CVD also saw buying pressure in the past couple of weeks, but the OBV presented a less clear picture. When the price was at $1.24 in February, the OBV was higher than it was this time around, as ADA approaches $1.24.
This meant that, in the past two months, the overall selling volume has been greater than buying. Was this indicative of a strong rally, or was this a liquidity grab?
Conclusion
The indicators showed bullish momentum and demand, except for the OBV which was on the rise but still had some ground to cover. The market structure was bullish and a push toward $1.4 seemed likely. A retest of $1.4 as support could see ADA push even higher, toward $1.62.


