ApeCoin, MANA, Fantom Price Analysis: 21 April

With Bitcoin regaining a position above its near-term EMAs, ApeCoin, and Fantom displayed a slight bullish edge on their 4-hour RSIs. Similarly, MANA broke out of its falling wedge while entering into a tight-neutral phase. But the overall trading volumes of these cryptos continued to stand weak at the time of writing.
ApeCoin (APE)
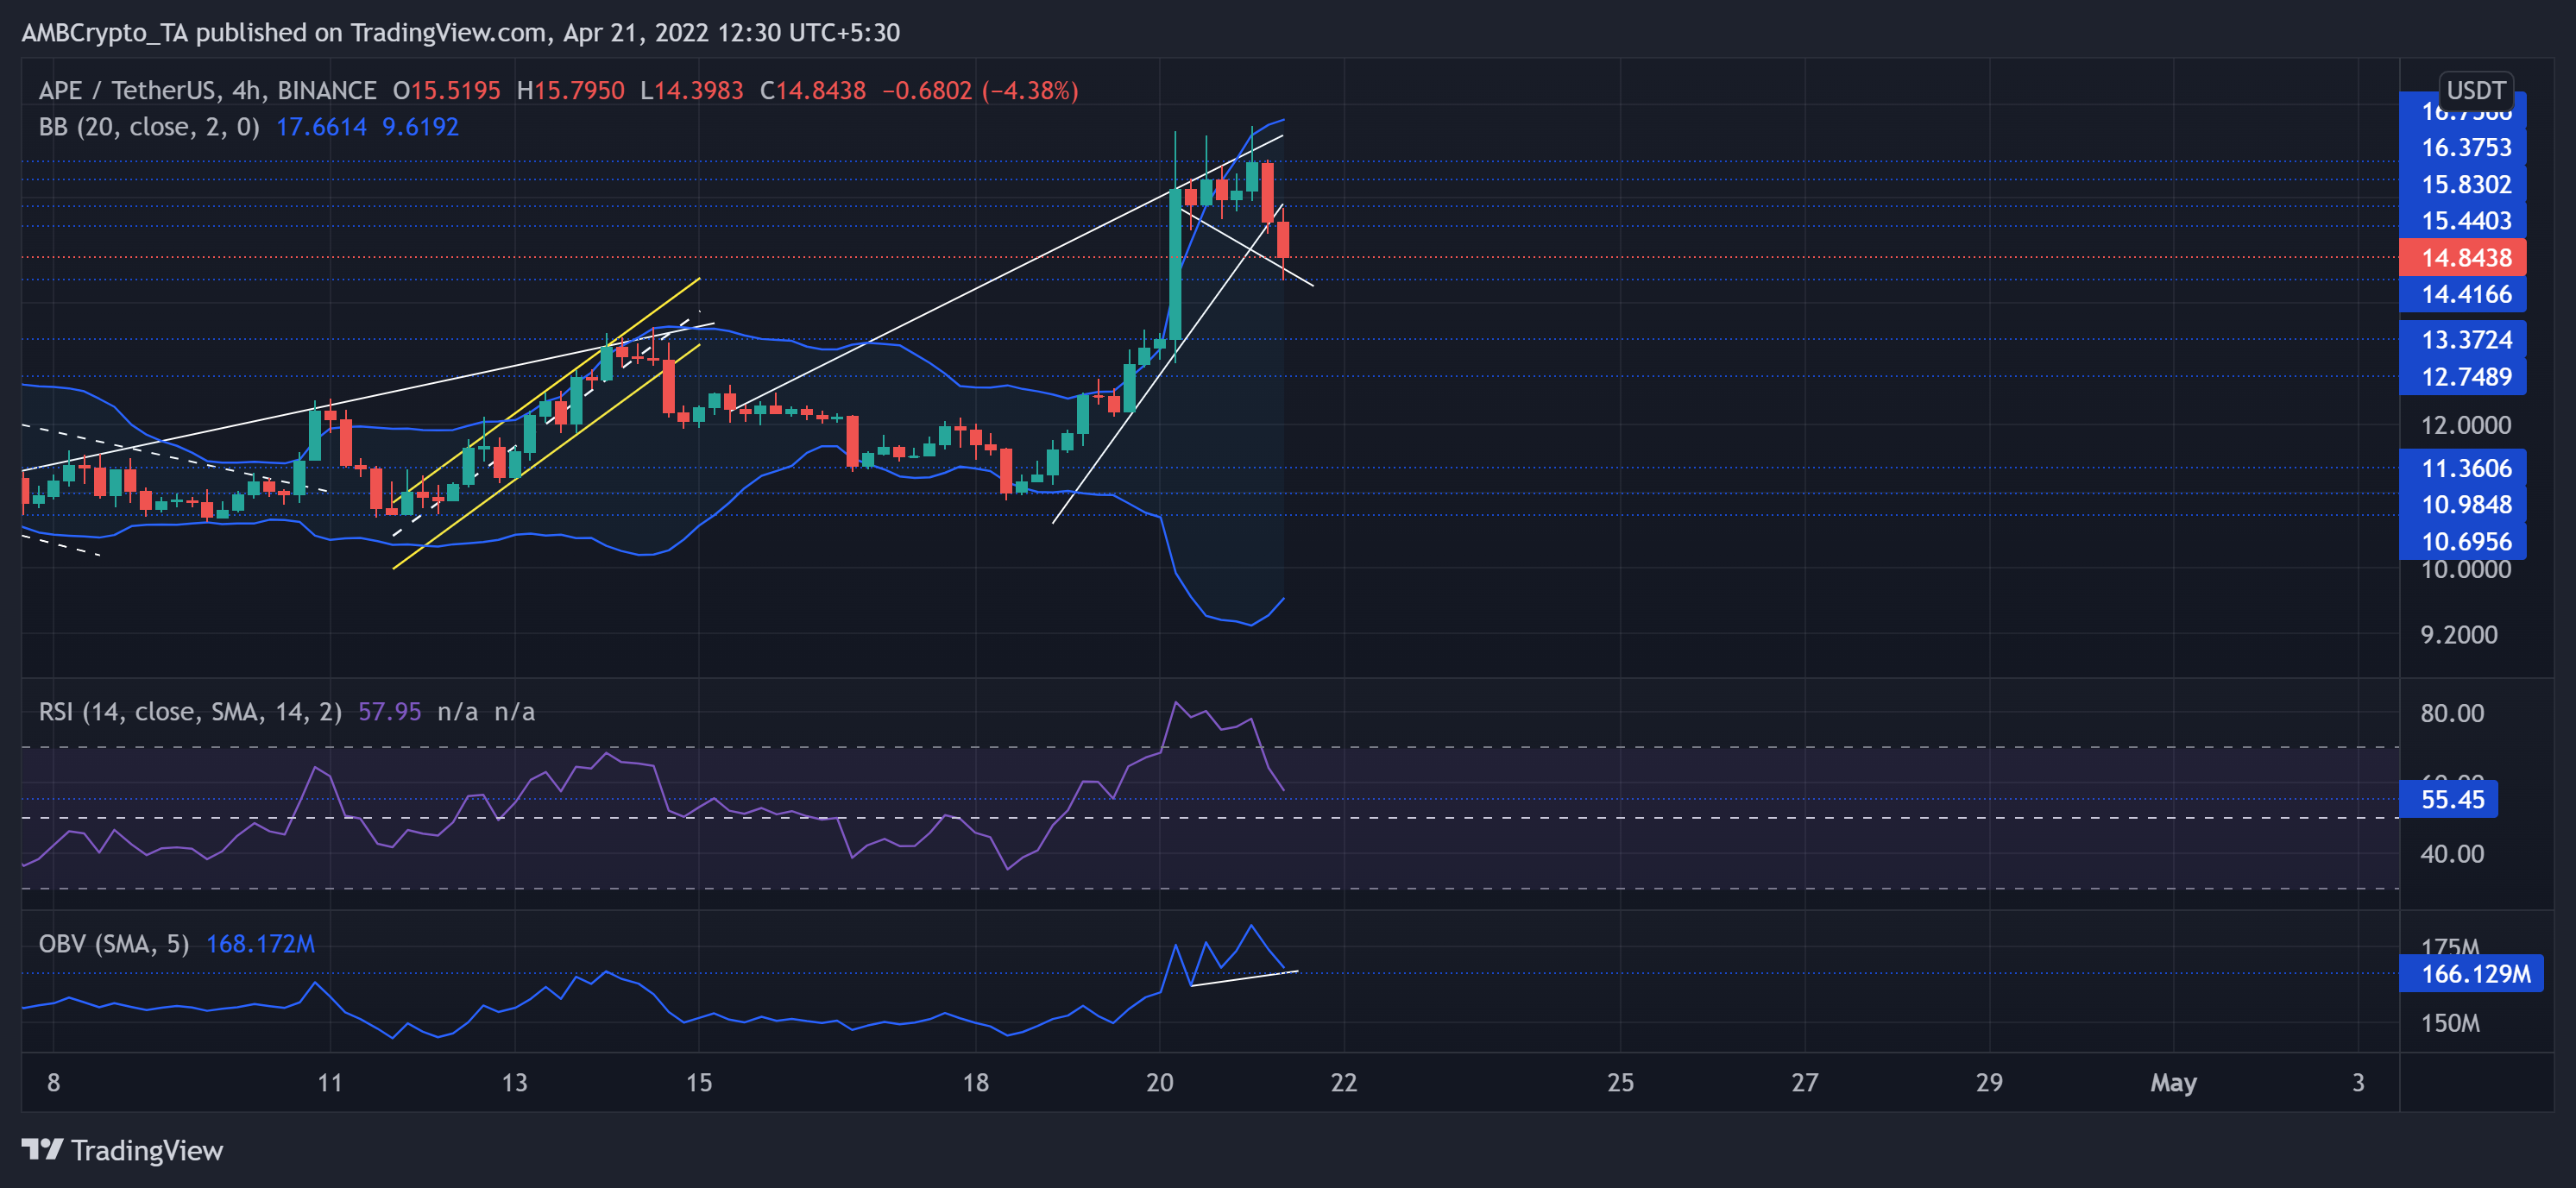
APE experienced an exponential surge after the buyers recouped at $10.98. This resurgence fetched the alt a gain of nearly 60% over the last three days toward the $16.7-mark. This retrieval phase marked a rising wedge (white) on the 4-hour chart.
As the price approached the ‘expensive’ territory on the Bollinger Bands (BB), the sellers quickly propelled a patterned breakdown at the $14-mark. While buying pressure eases, APE could head into a low volatility phase which could further be reflected in its BB.
At press time, APE traded at $14.84. The Relative Strength Index devalued after an expected reversal from the overbought region. Continued retracements from here could find a support range near the 50-55 range. On the other hand, the OBV managed to make higher troughs. So, any revival from its immediate support could confirm a bullish divergence with price.
Decentraland (MANA)
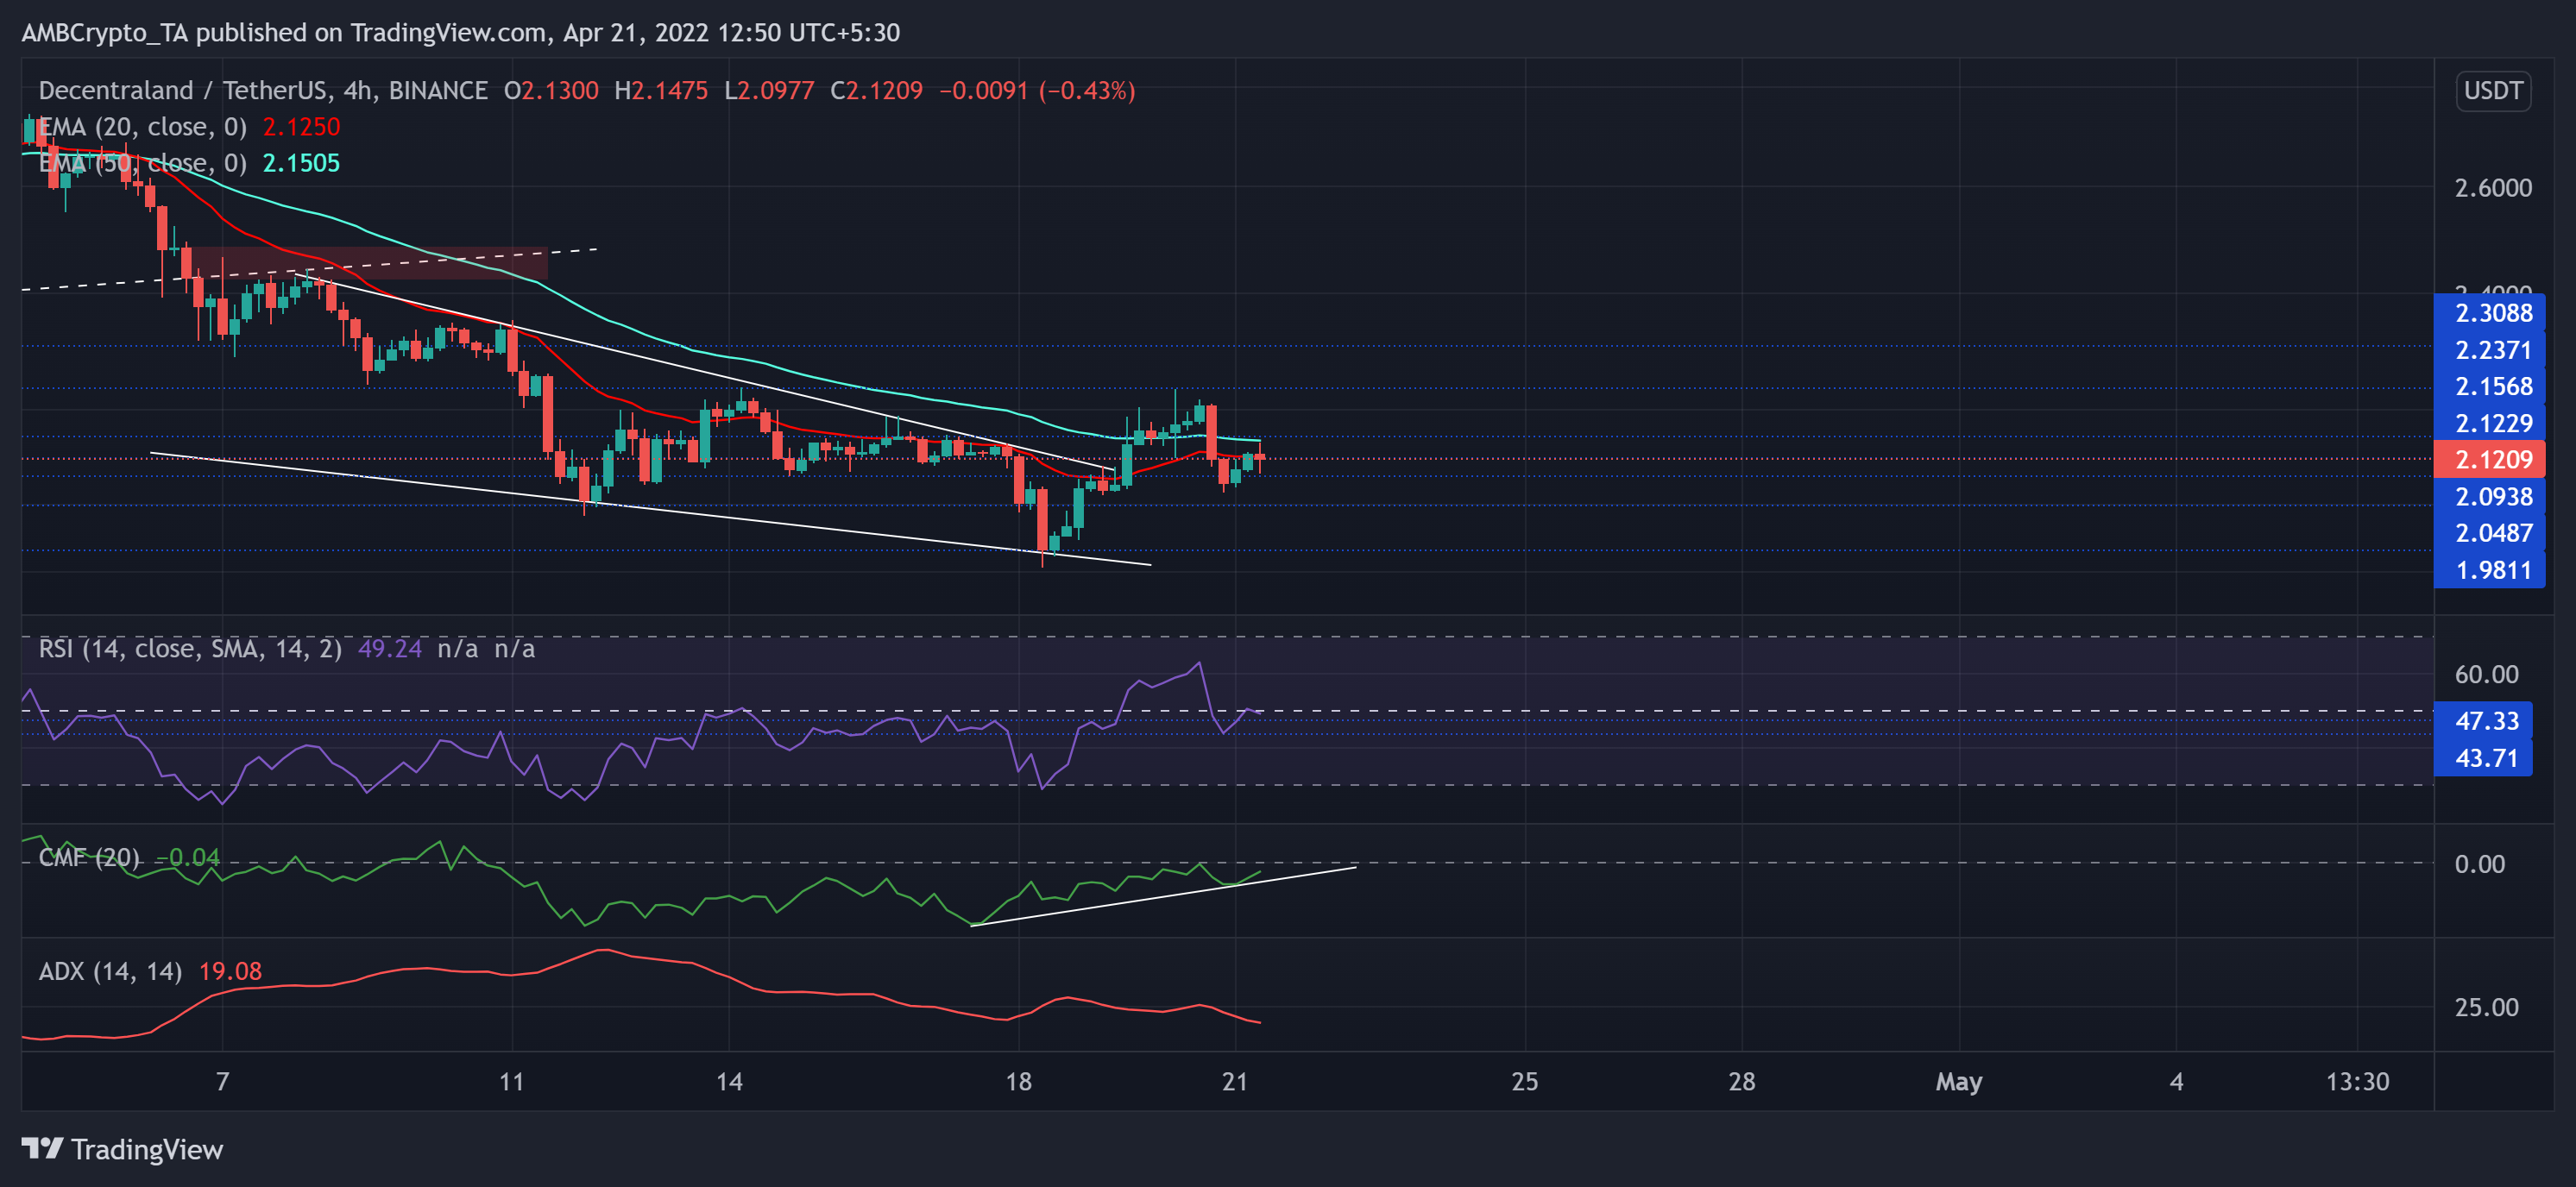
For over 10 weeks, MANA saw a gradual growth on its 4-hour troughs whilst marking a trendline support (now resistance) (white, dashed). But the bears didn’t tag along with the bullish narrative as they kept pushing the peaks consistently below critical price points.
After losing its trendline support, MANA descended in a falling wedge (white) on its 4-chart. After an expected breakout, the price hovered around its 20/50 EMA, inviting a high volatility phase in the days to come.
At press time, MANA was trading at $2.12, down by 2.92% in the last 24 hours. The alt’s RSI could not sustain itself above the mid-line while resting at the 43-47 range. The CMF projected an increasing buying vigor, but a close above the zero-mark was yet to be fulfilled to confirm a change in momentum. Meanwhile, the ADX continually depicted a weak directional trend for MANA.
Fantom (FTM)
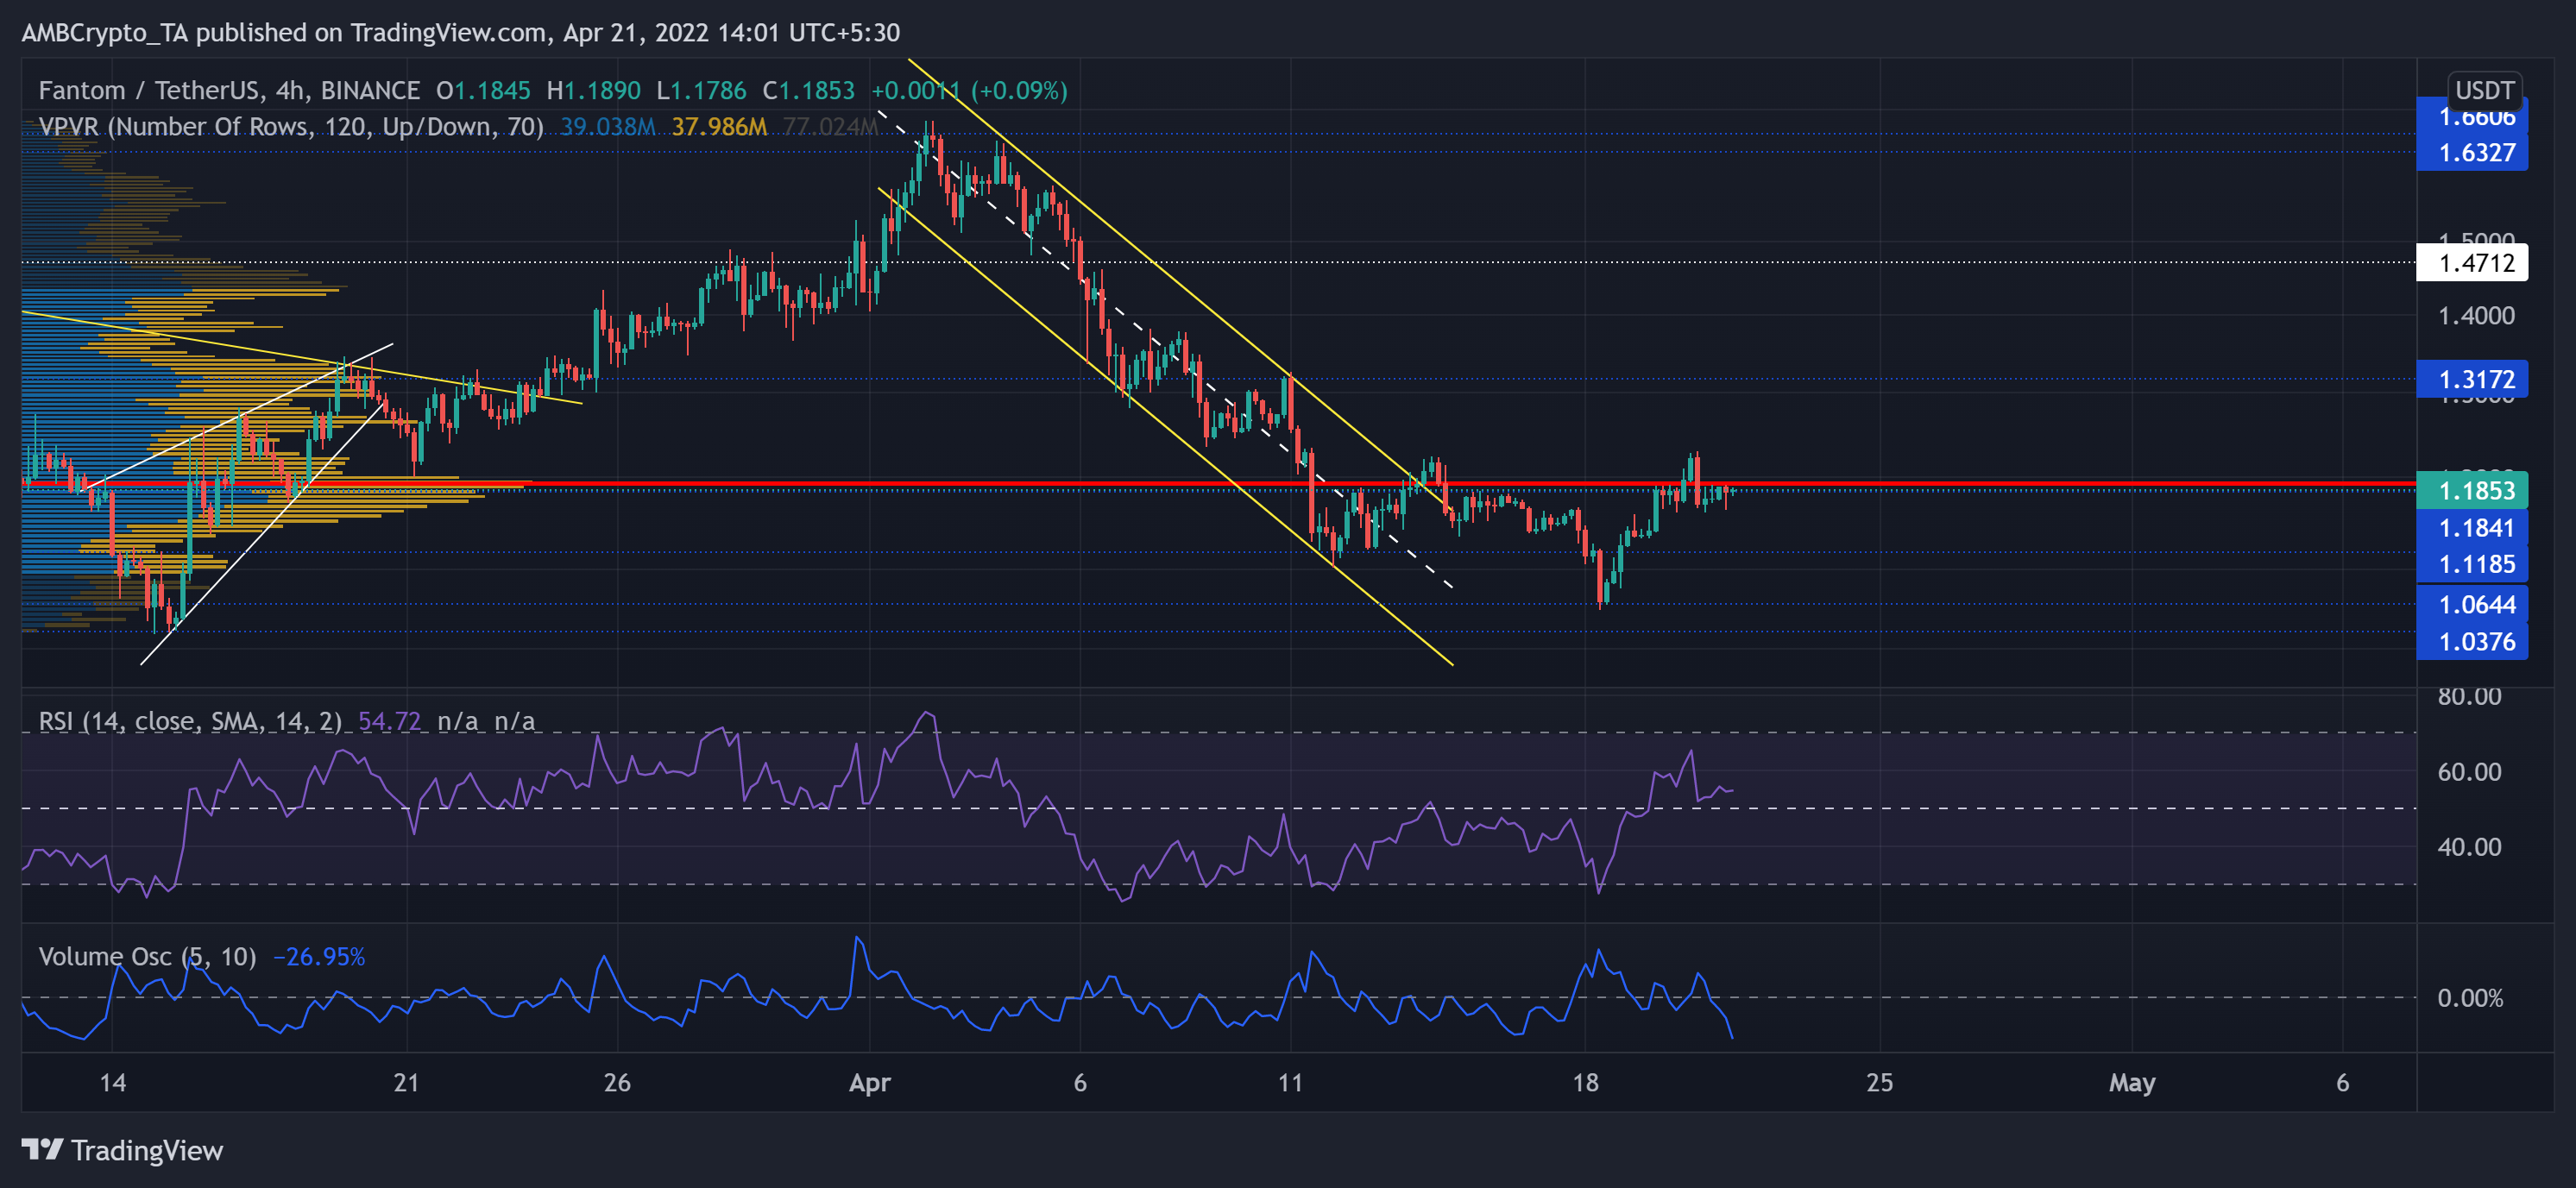
Since FTM dropped from $1.6, the bulls finally found their base at the $1.03-$1.06 range. The digital currency lost nearly 37.05% of its value (from 2 April) and hit its monthly low on 18 April.
Following the broader recovery, the alt was up by over 11% in just the last three days. A close above the Point of Control would be imperative to continue the existing rally.
At press time, FTM was trading at $1.1853. The RSI did find a comfortable close above the mid-line and exhibited a bullish stance. But the southbound Volume Oscillator depicted weak volumes on the current bull run. Thus, making the recent gains rather fragile.