Arbitrum slashes gas fee by 90%: Surge in demand to follow?
Transaction costs on Arbitrum plunge as the Layer 2 network implements a new upgrade.

- The cost of using Arbitrum One has fallen to a new low.
- This is due to the rollout of phase 2 of the ArbOS Atlas upgrade.
Transaction fees on leading Layer 2 (L2) platform Arbitrum [ARB] have fallen to new lows following the implementation of the second phase of its ArbOS Atlas.
In a post on X (formerly Twitter), the L2 solutions provider confirmed the rollout of phase two of the ArbOS Atlas, which is designed to make it support Ethereum’s Dencun upgrade and significantly lower the overall cost of using the network.
The new lows in Arbitrum fees come after the network’s average transaction fee initially declined post-Dencun upgrade on the 13th of March.
AMBCrypto had reported that average transaction fees on L2 solutions providers plummeted by over 90% a day after the Dencun hardfork.
According to a Dune Analytics dashboard, the average cost of processing a transaction on Arbitrum was $0.029 at press time, having declined by 93% since the Dencun upgrade.
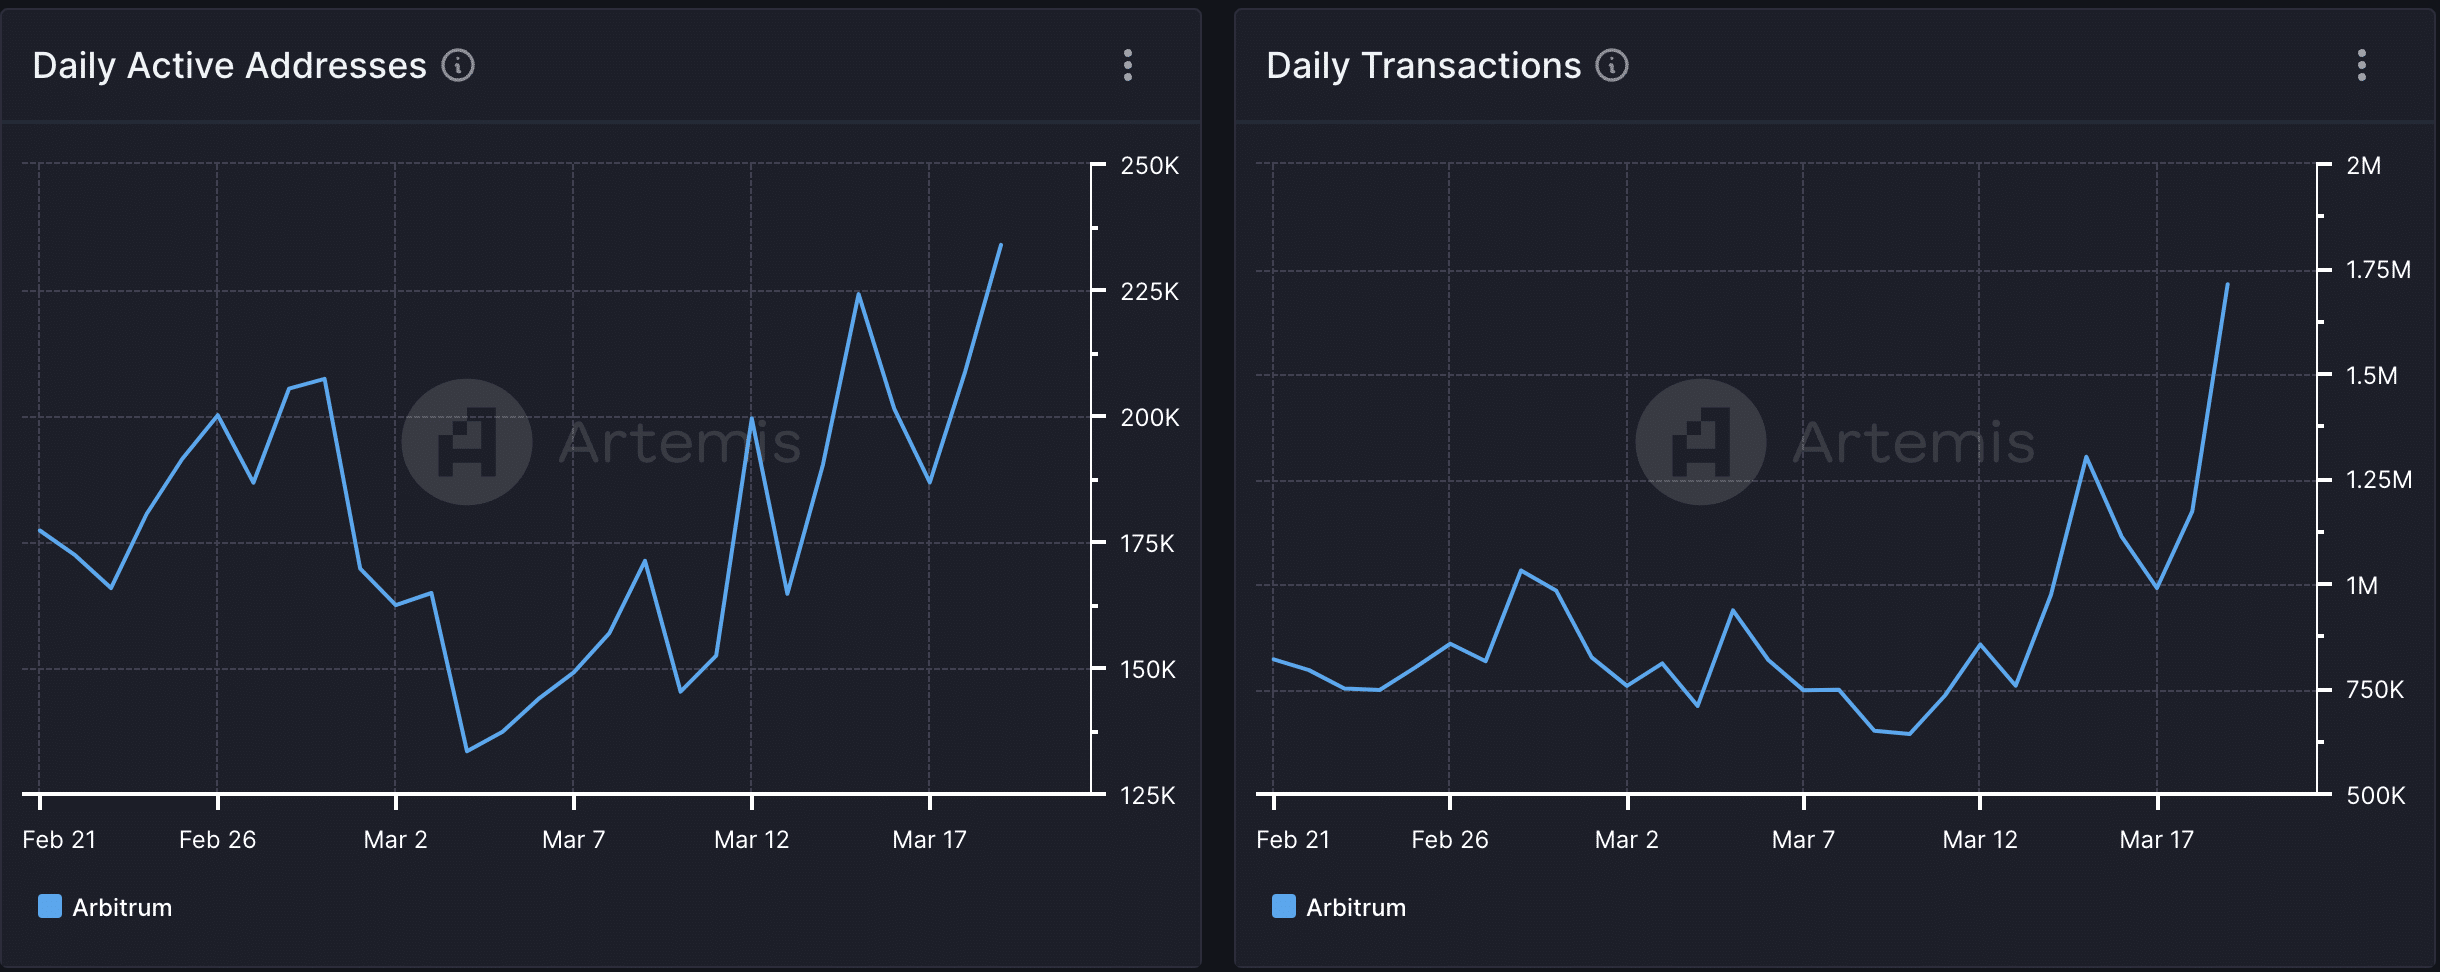
User activity on Arbitrum since the upgrade
Users have taken advantage of the low fees on the network, as Arbitrum has recorded an uptick in network demand since the implementation of the Dencun upgrade.
Per Artemis’ data, the daily count of unique on-chain wallets interacting with the L2 network has grown by 42% since the 13th of March.
As a result, the network’s daily transaction count has risen correspondingly. Information from the same data provider showed that the number of unique on-chain interactions recorded on Arbitrum since Dencun has increased by 125%.
However, the network’s daily revenue has declined due to the fall in transaction fees. As of 19th March, Arbitrum’s revenue totaled $75,000, marking a 69% decline from the $241,000 it saw in revenue on the 15th of March.
The bulls may have been sidelined
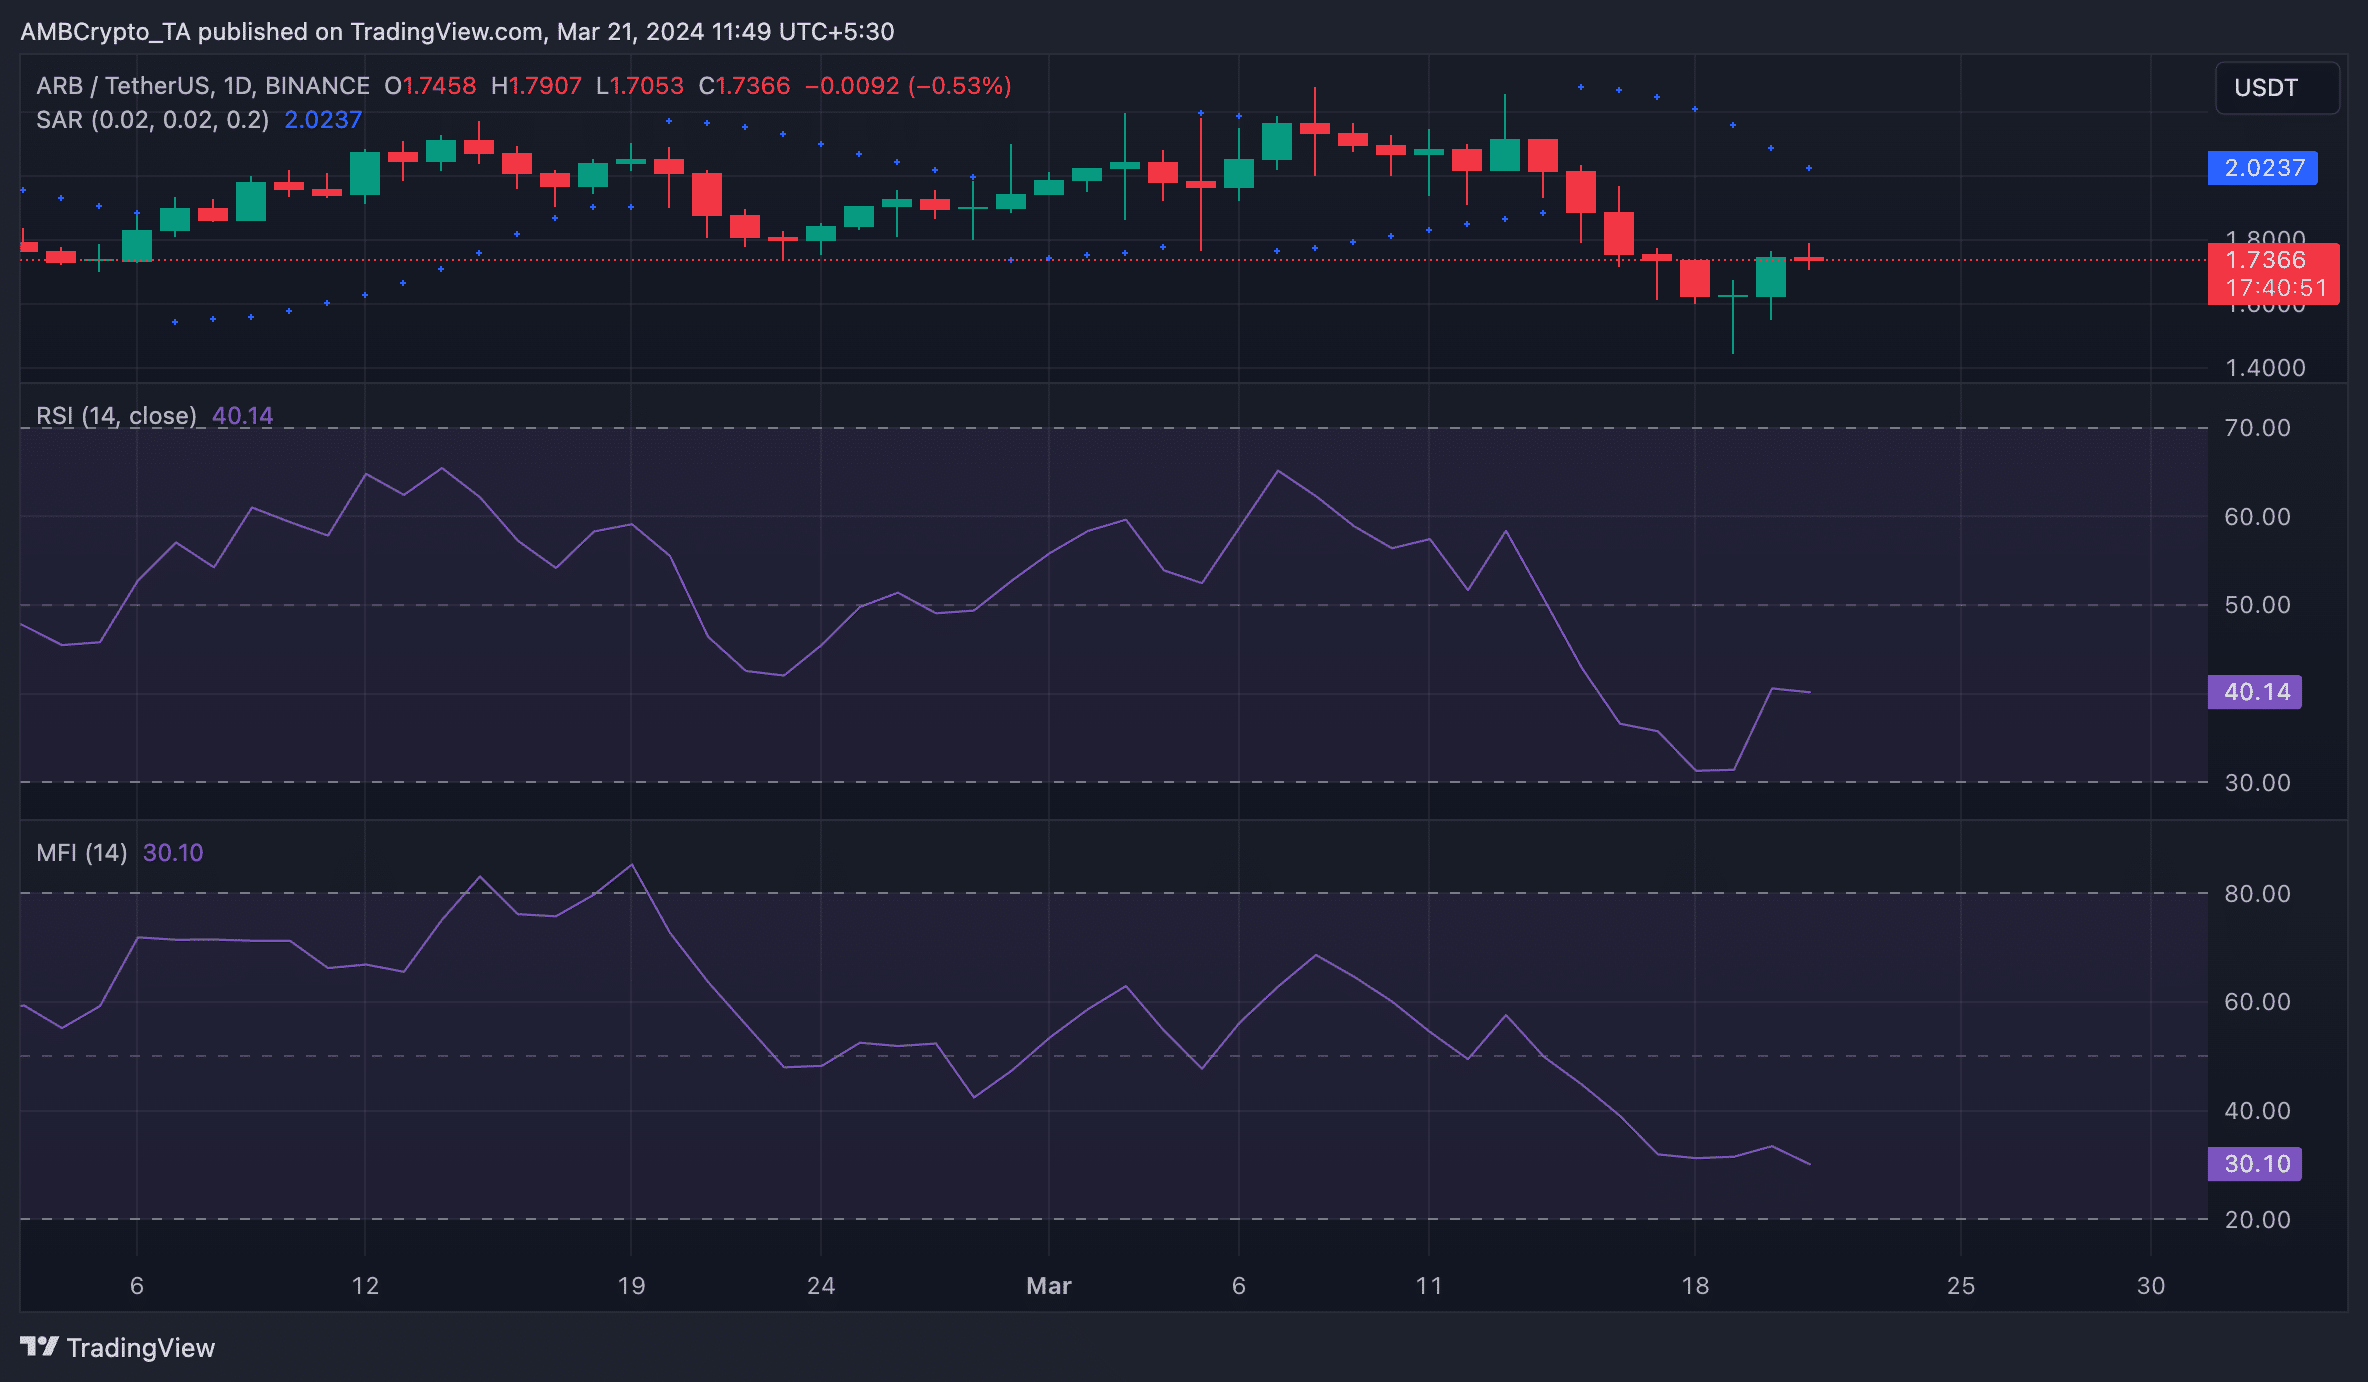
At press time, ARB exchanged hands at $1.74. In the last week, the altcoin’s value dropped by 16%, according to CoinMarketCap’s data.
The double-digit decline in the token’s value was due to the preference for distribution amongst its spot market participants. AMBCrypto assessed ARB’s performance on a 24-hour chart and found that its key momentum indicators trended downwards and were positioned below their neutral lines.
For example, ARB’s Relative Strength Index (RSI) and Money Flow Index (MFI) were 40.14 and 30.10, respectively. These values showed that token sell-offs outpaced accumulation.
Read Arbitrum’s [ARB] Price Prediction 2024-25
Confirming the presence of bearish sentiments, the dotted lines that make up ARB’s Parabolic SAR (Stop and Reverse) indicator were spotted above ARB’s price at press time.
This indicator measures an asset’s potential trend direction and reversals. When the dotted lines rest above an asset’s price, the market is deemed to be in a downtrend. Many traders interpret this as the time to exit long positions or initiate short positions.