Are Ethereum bears emerging from the shadows?
ETH’s supply has declined to its lowest level since the network’s merge event in September 2022.

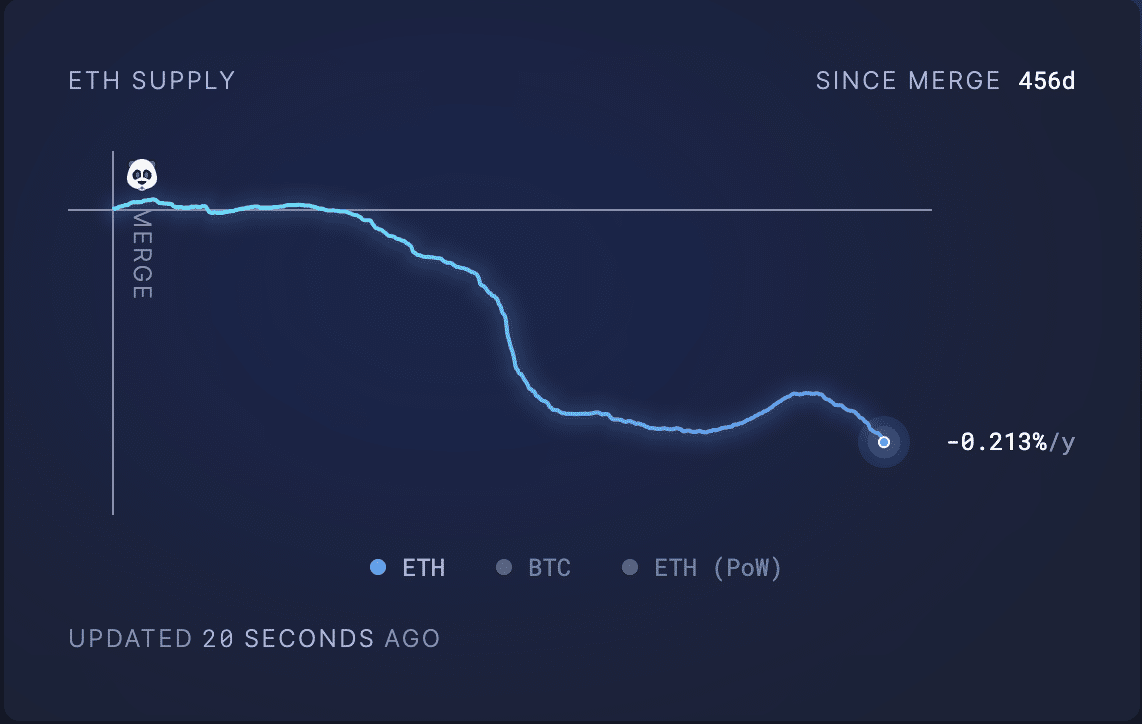
- ETH’s supply has dropped to its lowest level since the merge.
- A key indicator has shown the re-emergence of the bears in the ETH spot market.
Ethereum’s [ETH] supply has fallen to its lowest since the blockchain transitioned from the proof-of-work consensus mechanism (PoW) to a proof-of-stake (PoS) network in an event popularly referred to as “The Merge.”
Although the week has witnessed an elevated cost of sending and receiving ETH, the network has also burned a significant amount of the cryptocurrency, leading to a shrinking overall supply.
According to data from Ultrasound.money, 31,829.06 ETH worth around $71.58 million have been burned in the last week. Within the same period, newly issued coins totaled 16,535 ETH.
AMBCrypto found that since the merge, 320,870.92 ETH worth $721.68 million at the coin’s current price has been removed from circulation. At press time, the leading altcoin’s supply was 120.2 million ETH.
Profit-takers control the market
At press time, the network’s native coin traded at $2,249. Sharing a statistically significant correlation with Bitcoin [BTC], whose value has fallen by 5% in the last week, ETH’s value has dipped by 6% within that period.
As profit-taking activity intensifies, there has been a steady decline in ETH accumulation. An on-chain assessment of the coin’s network activity on a seven-day simple moving average revealed a drop in demand for the altcoin.
Data from Santiment showed that in the last week, the daily count of active addresses involved in ETH transactions has decreased by 2%.

The decline in ETH’s network activity coincides with the re-emergence of the bears, as readings from the coin’s Moving Average Convergence/Divergence indicator (MACD) showed.
On 12th December, the MACD line crossed below the trend line. This movement signaled the weakening of the coin’s upward momentum, which ushered in the bears.
Since then, ETH’s Relative Strength Index (RSI) and Money Flow Index (MFI) have trended downwards, suggesting that coin distribution has exceeded accumulation.

Read ETH’s Price Prediction 2023-24
Moreso, amid the decline in demand for the alt, there has been an increase in its supply on exchanges in the past few days. According to data from CryptoQuant, ETH’s exchange reserve has seen a 0.35% uptick in the last week.
This confirmed the trend of ETH holders sending their coins to exchange for onward sales to take a profit. As of this writing, ETH’s exchange reserve was 14.27 million ETH.


