Are Solana’s bulls really strong enough to halt further decline

Disclaimer: The findings of the following analysis are the sole opinions of the writer and should not be taken as investment advice
Bitcoin fell under the $50k-mark over the last 24 hours, at the time of writing. Consequently, altcoins across the market also posted losses for the day. Solana appeared to rise above a key level but the lack of demand proved ominous. Soon thereafter, bears were able to force the price back below $190. Whether bulls can muster enough strength to stop the bears’ charge in the $168-$174 area remains to be seen.
Solana – 4 hour chart
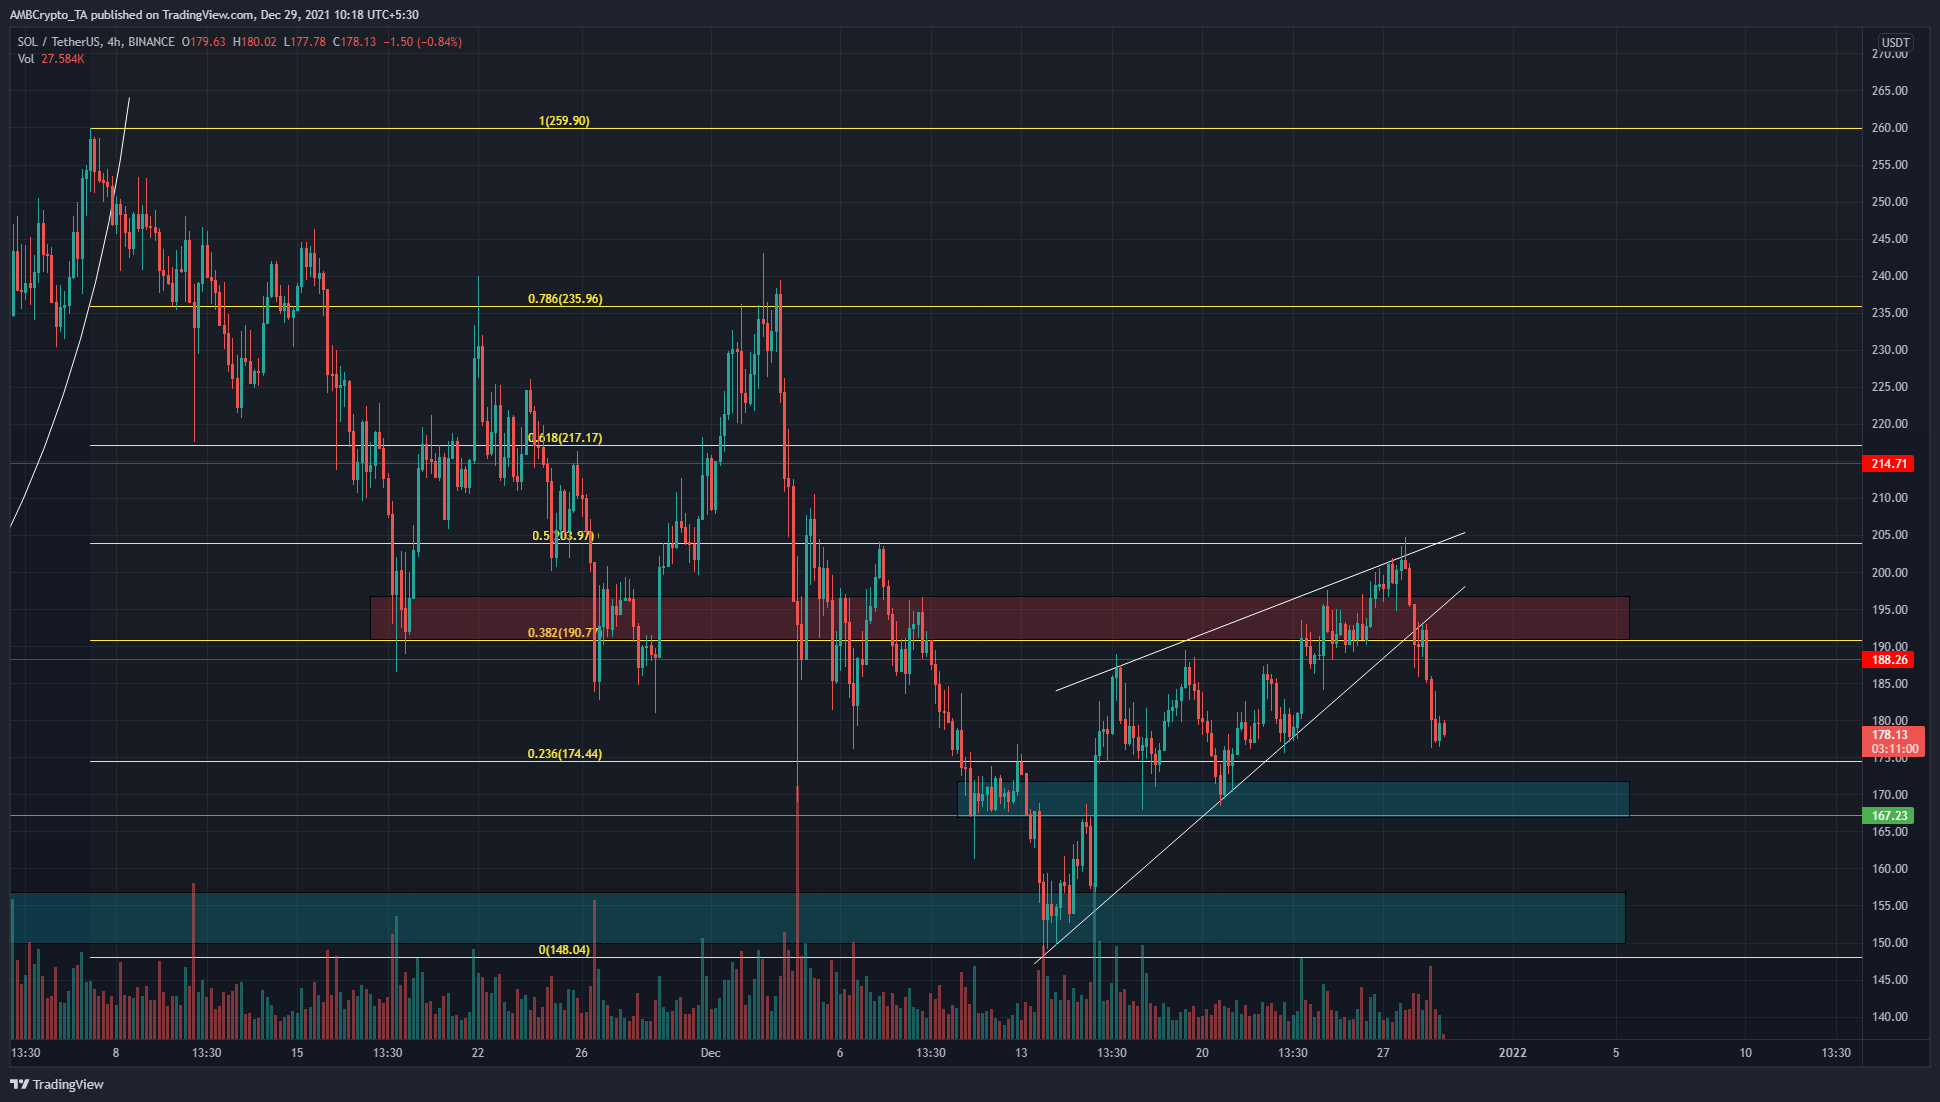
The price formed an ascending wedge pattern (white) and broke beneath the $195 zone (red box) that had been an area of strong supply recently. SOL appeared to have flipped it to demand, but before long sellers made their presence felt.
Using the swing high and low at $259.9 and $148, the 23.6% Fibonacci retracement level at $174 can be considered the next support level for SOL. Right under it is the $168 demand zone (cyan box) where liquidity is likely to be strong. $167 is also a higher timeframe support level.
Price seeks liquidity, and some time would be needed to assess SOL’s reaction in the $168-$174 area. If long lower wicks were seen alongside good trading volume, it would be a sign of strength from bulls.
Rationale
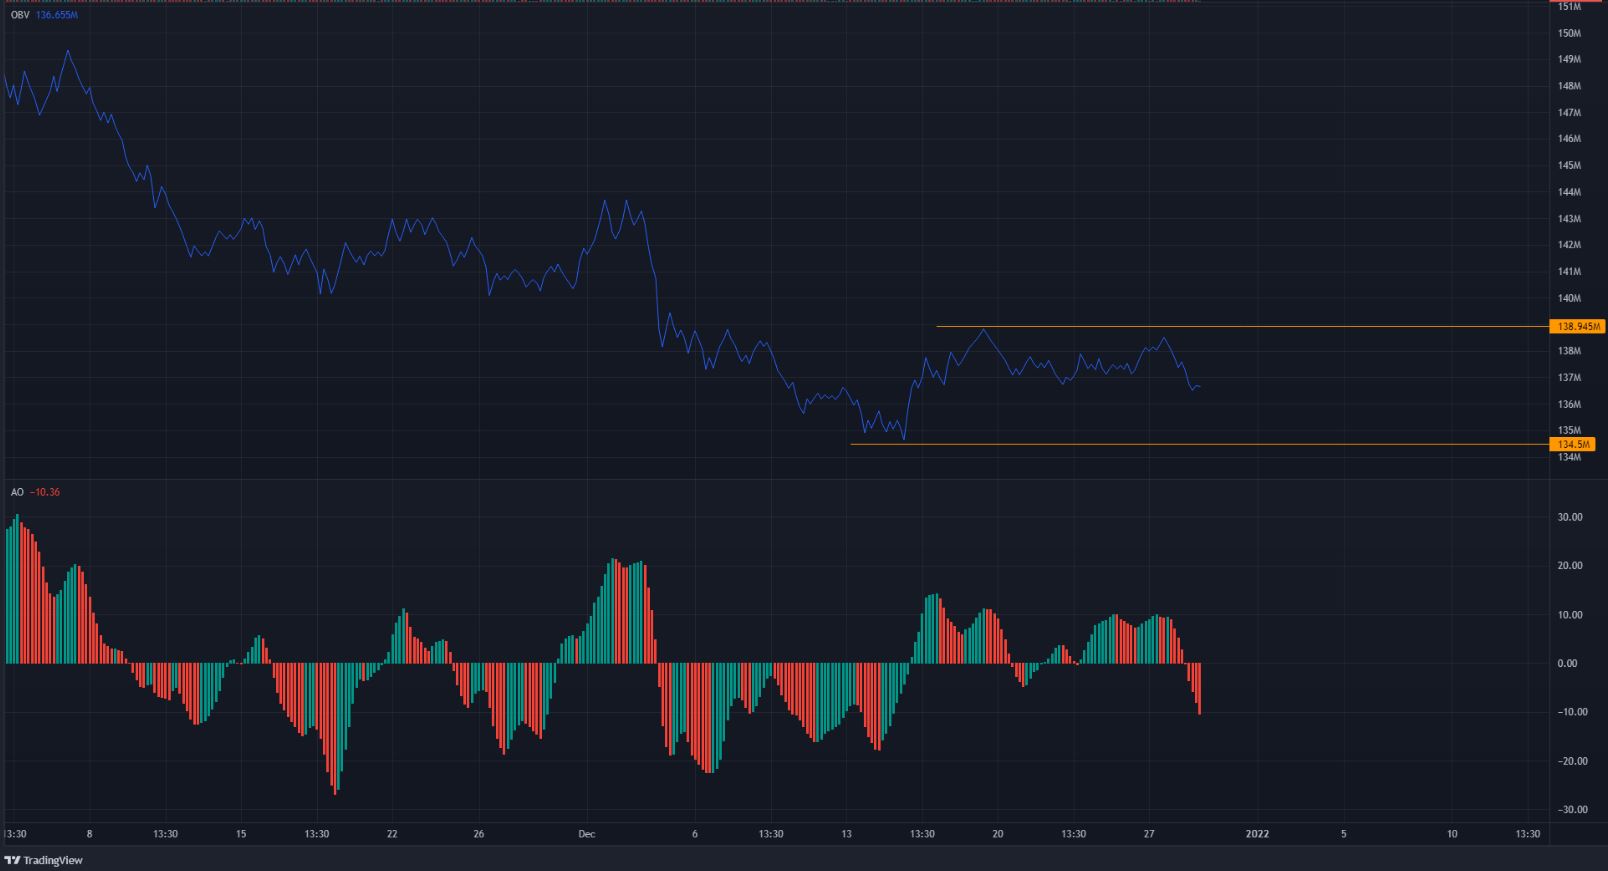
While we want to see a good reaction from bulls, the past few days have not been dominated by buyers of Solana. The OBV showed two levels that have been established recently, but are yet to be broken. Even though the price made a series of short-term higher highs (wedge pattern), the OBV was in disagreement as it set no new higher highs.
This is something that would have to change. The strong selling pressure in early December appeared to have halted on the OBV, but demand is yet to be seen.
The Awesome Oscillator sunk under the zero line to indicate a shift in momentum from bullish to bearish.
Conclusion
Buying strength was unseen, at press time. It was also too late to open short positions. The next area of value for traders likely lay around the $170-zone. A tussle between bears and bulls in this area is expected, and the winner would likely set SOL’s direction for the next few days. This means either another push to $190 or a drop to $150.


