Analysis

As Bitcoin reclaims $20k, can BTC traders drive bulls to aim for the sky
Posted:
Journalist

Disclaimer: The findings of the following analysis are the sole opinions of the writer and should not be considered investment advice.
The downtrend from November was still in play for Bitcoin [BTC]. The ascent back above $20k can be encouraging for lower timeframe traders and liquidated many participants bearishly positioned.
Long-term investors might want to await another strong drop. However, it could be the case that such a drop might be a month or two away. Until Bitcoin can climb above $24.5k, the long-term trend won’t be strongly bullish. In the meantime, there are pockets of liquidity that the price could target.
BTC- 1-Day Chart
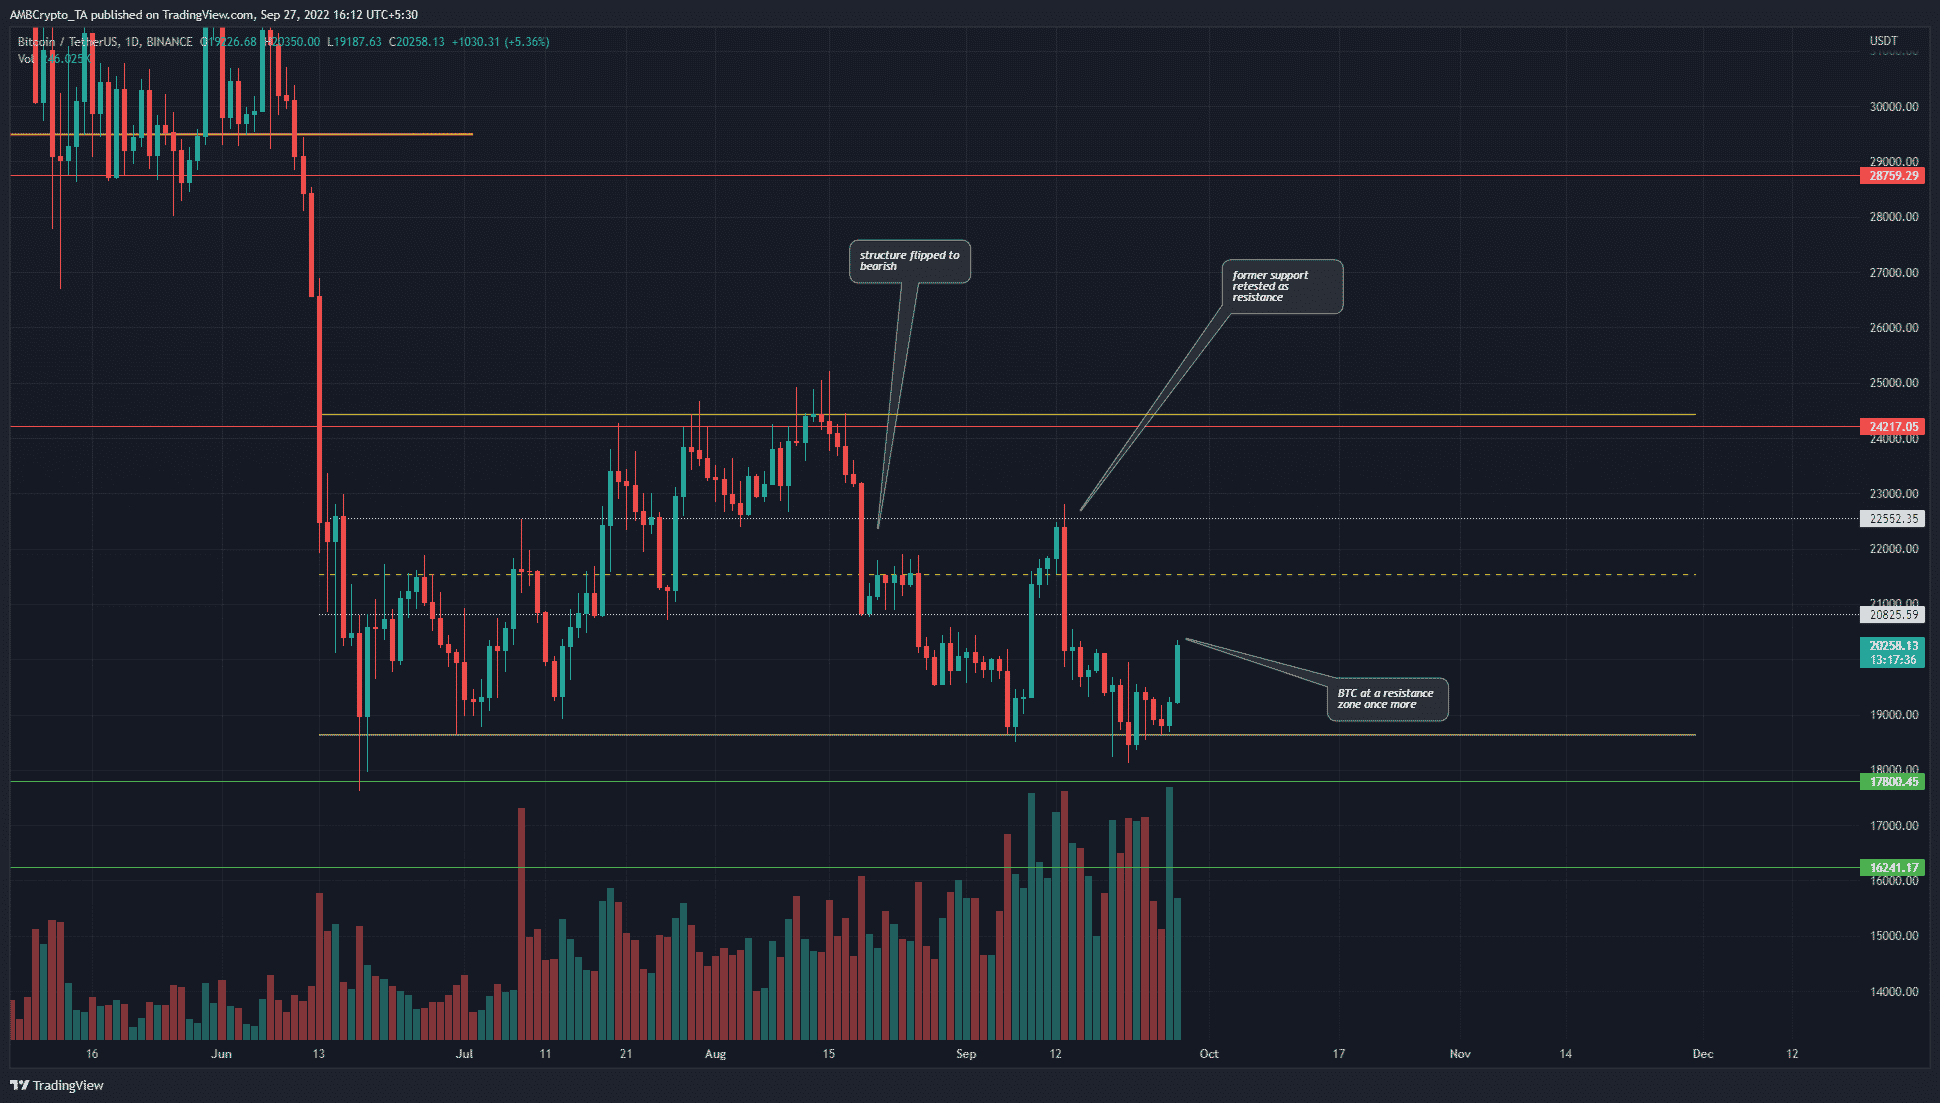
Source: BTC/USDT on TradingView
Bitcoin saw large amounts of volatility in recent months. The fall beneath the $29k range lows saw another range begin to develop over the past three months. Highlighted in yellow, this range extended from $24.5k to $18.6k.
The mid-point of the range lay at $21.5k. The $21.5k zone has also acted as a good support and resistance zone over the same time period.
Beside the mid-range mark are two key levels at $22.2k and $20.8k. An examination of the BTC market structure on the H12 chart showed a bearish leaning owing to the formation of a lower low near $18.6k.
To the north, a stiff zone dominated by sellers loomed large. Bitcoin would need to flip the $21.5k to support over the next few days in order to have a chance of moving toward $24k next week.
Rationale
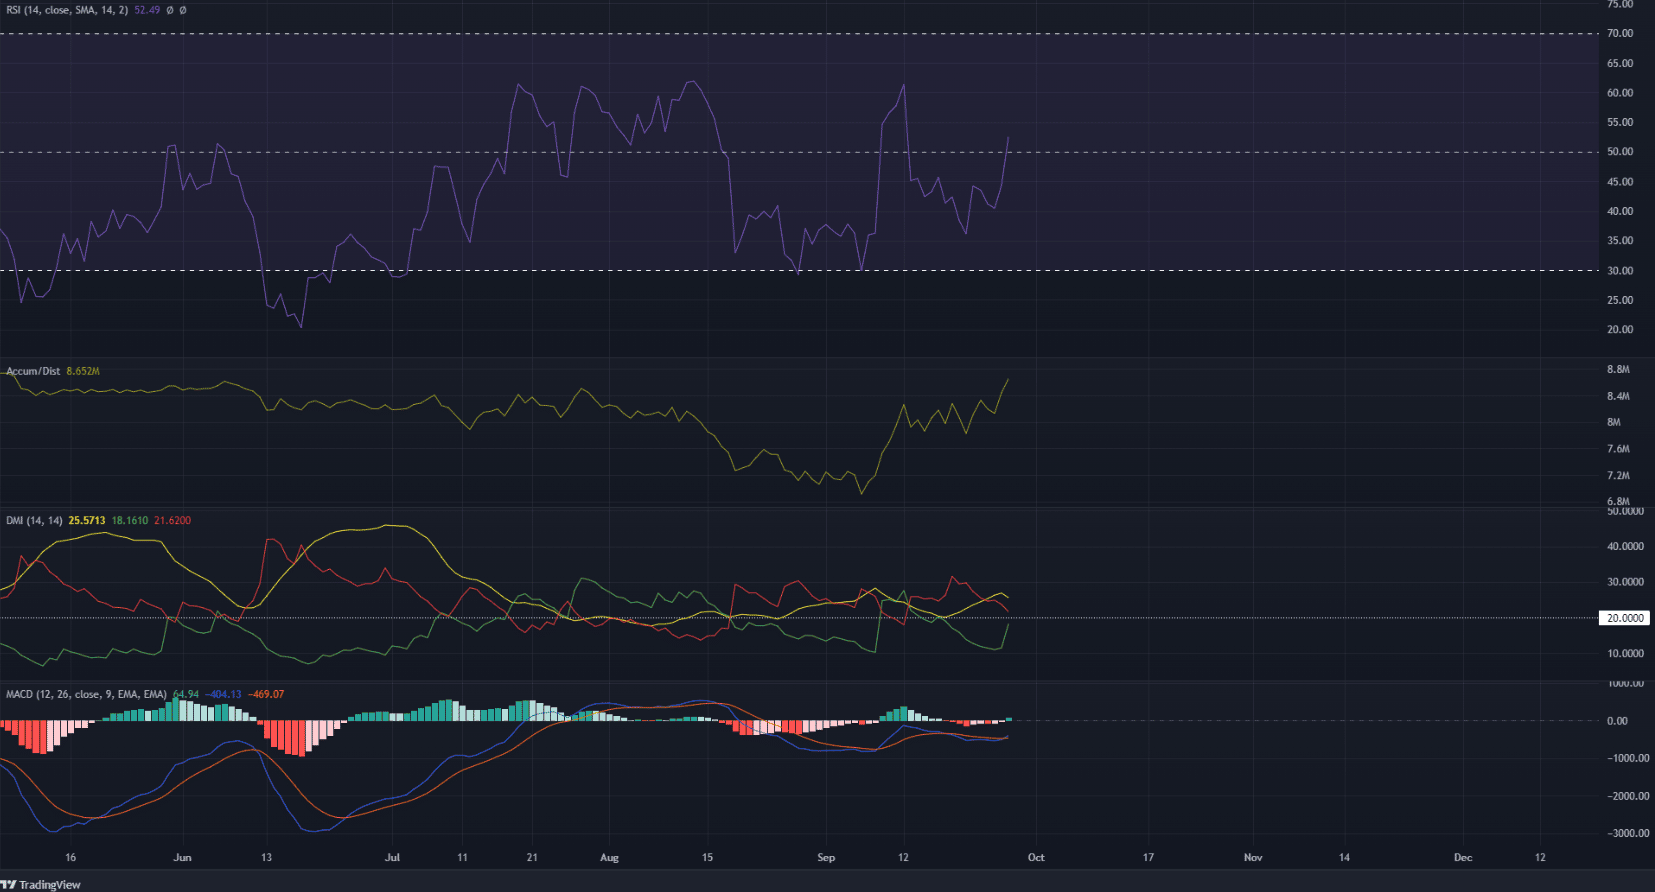
Source: BTC/USDT on TradingView
The indicators all showed bullish intent. The Relative Strength Index (RSI) was in the process of making a crossover back above neutral 50, while the Moving Average Convergence Divergence (MACD) also made a bullish crossover beneath its zero line. Taken together the momentum indicators showed some upward momentum but not a strong trend yet.
The Directional Movement Index (DMI) showed a strong bearish trend in progress, albeit a weakening one as the -DI (red) dove toward the 20 mark and could slide lower. The Accumulation/Distribution (A/D) line saw a surge upward in early September, but it has not yet decisively overcome the resistance from June.
Conclusion
Risk averse traders can wait for a rejection from the $20.8k region before scaling into a short position. On the other hand, short-term bulls will look for a test of $20.8k and a retest of the lower timeframe resistance at $20.2k to buy BTC.
At the time of writing BTC was not at a good risk-to-reward zone to trade for higher timeframe traders, either buyers or sellers. A shorting opportunity on lower timeframes can be explored near $20.8k and $21.5k.